Visual Guide & Infographics

Infographics

PolicyWatcher v5.0.0 diagrams cover adaptive workspaces, shareable views, evidence drill-downs, release impact and safety overrides.

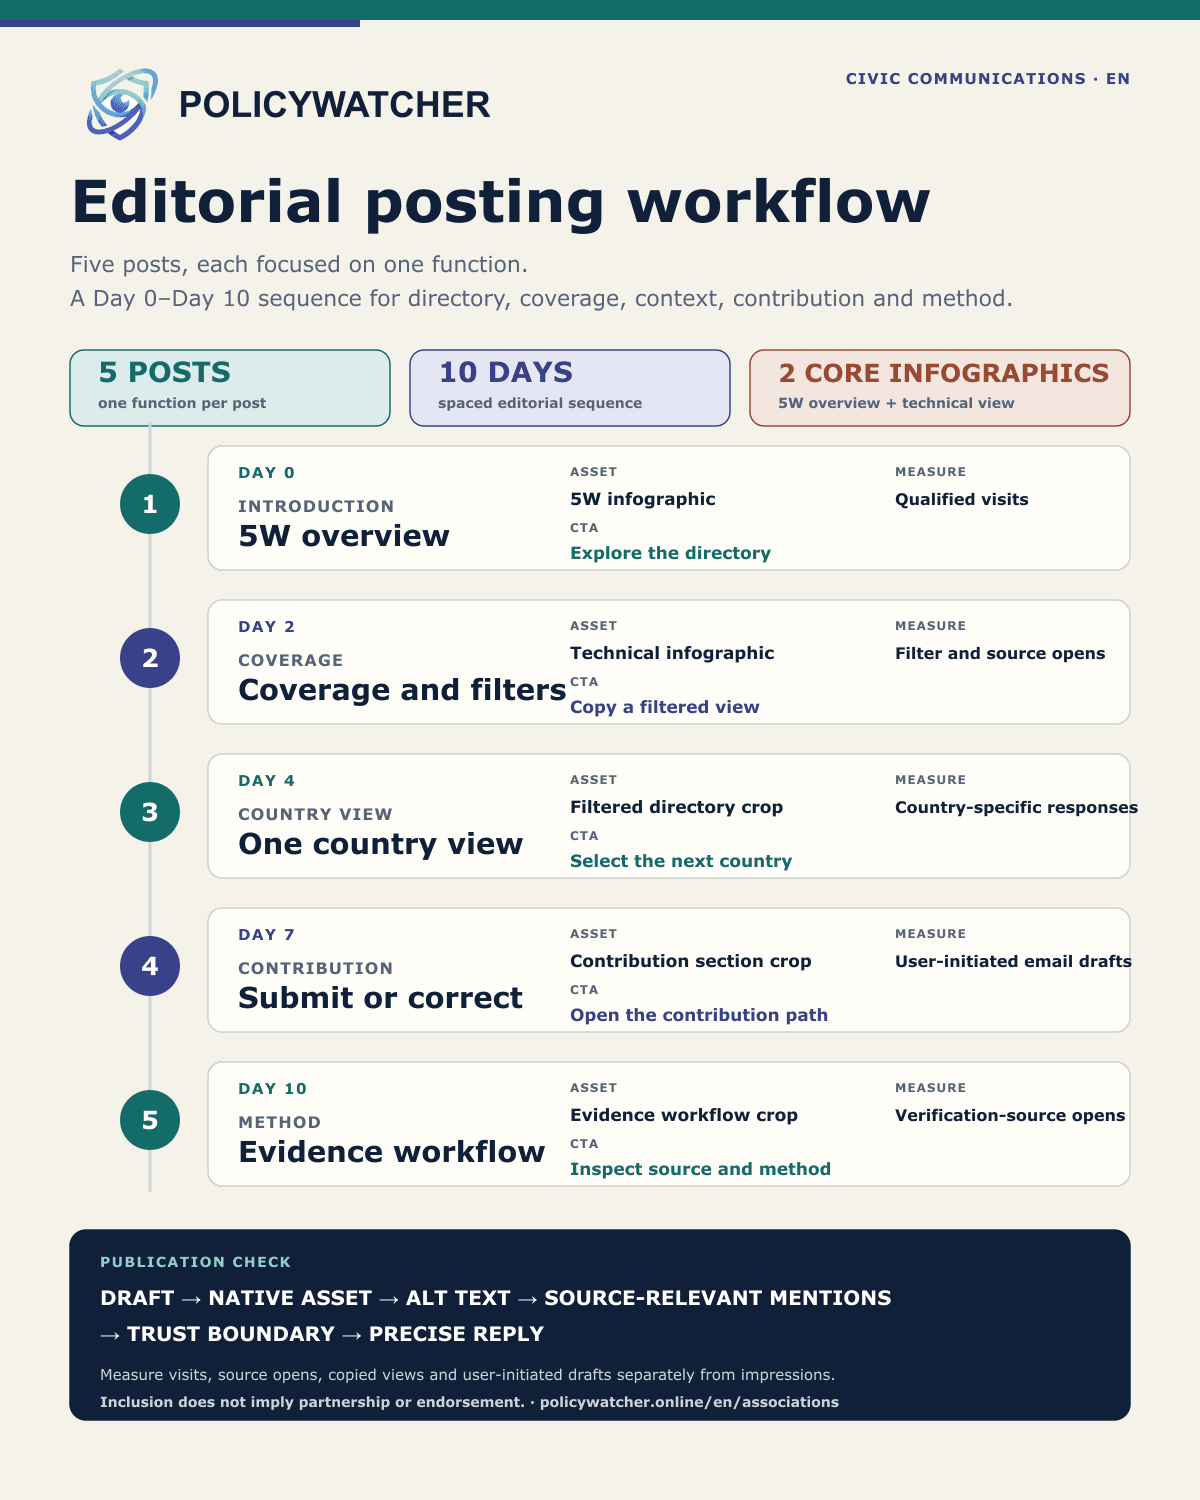
Infographic 09 · Editorial workflow · 18 August 2026

Civic editorial workflow

A descriptive Day 0-Day 10 sequence for introducing the directory, explaining coverage, showing one country view, documenting the contribution path and presenting the evidence method.
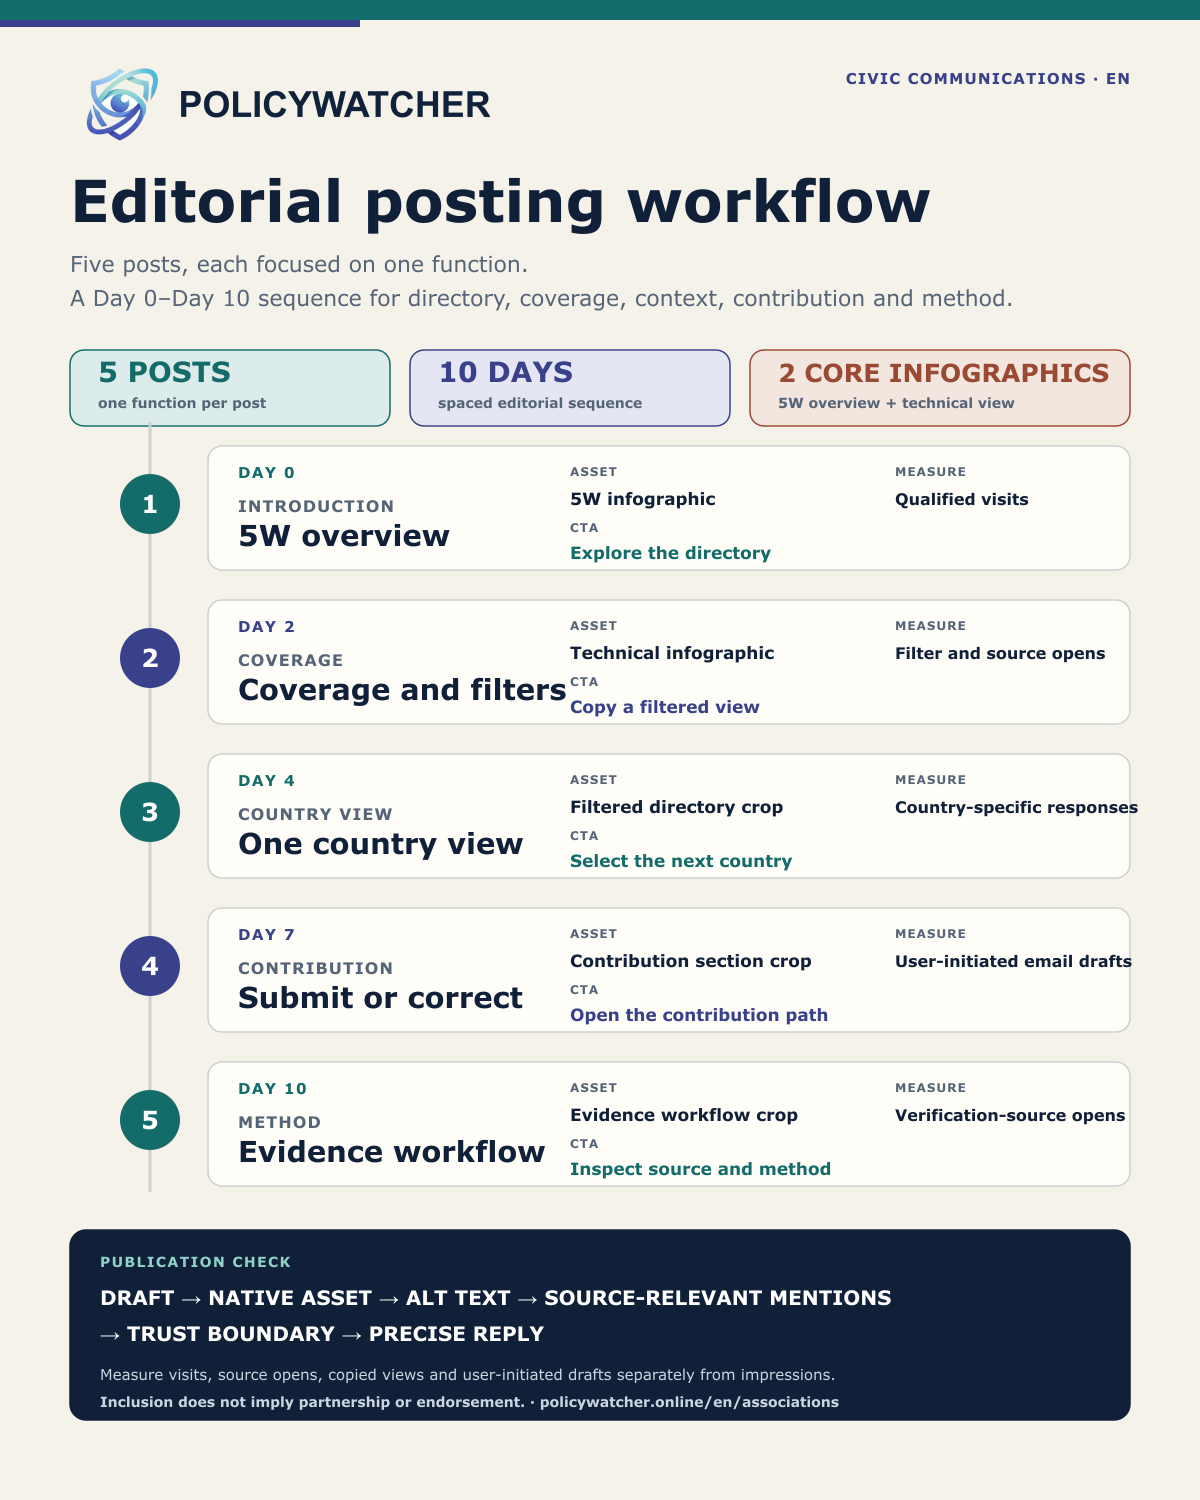
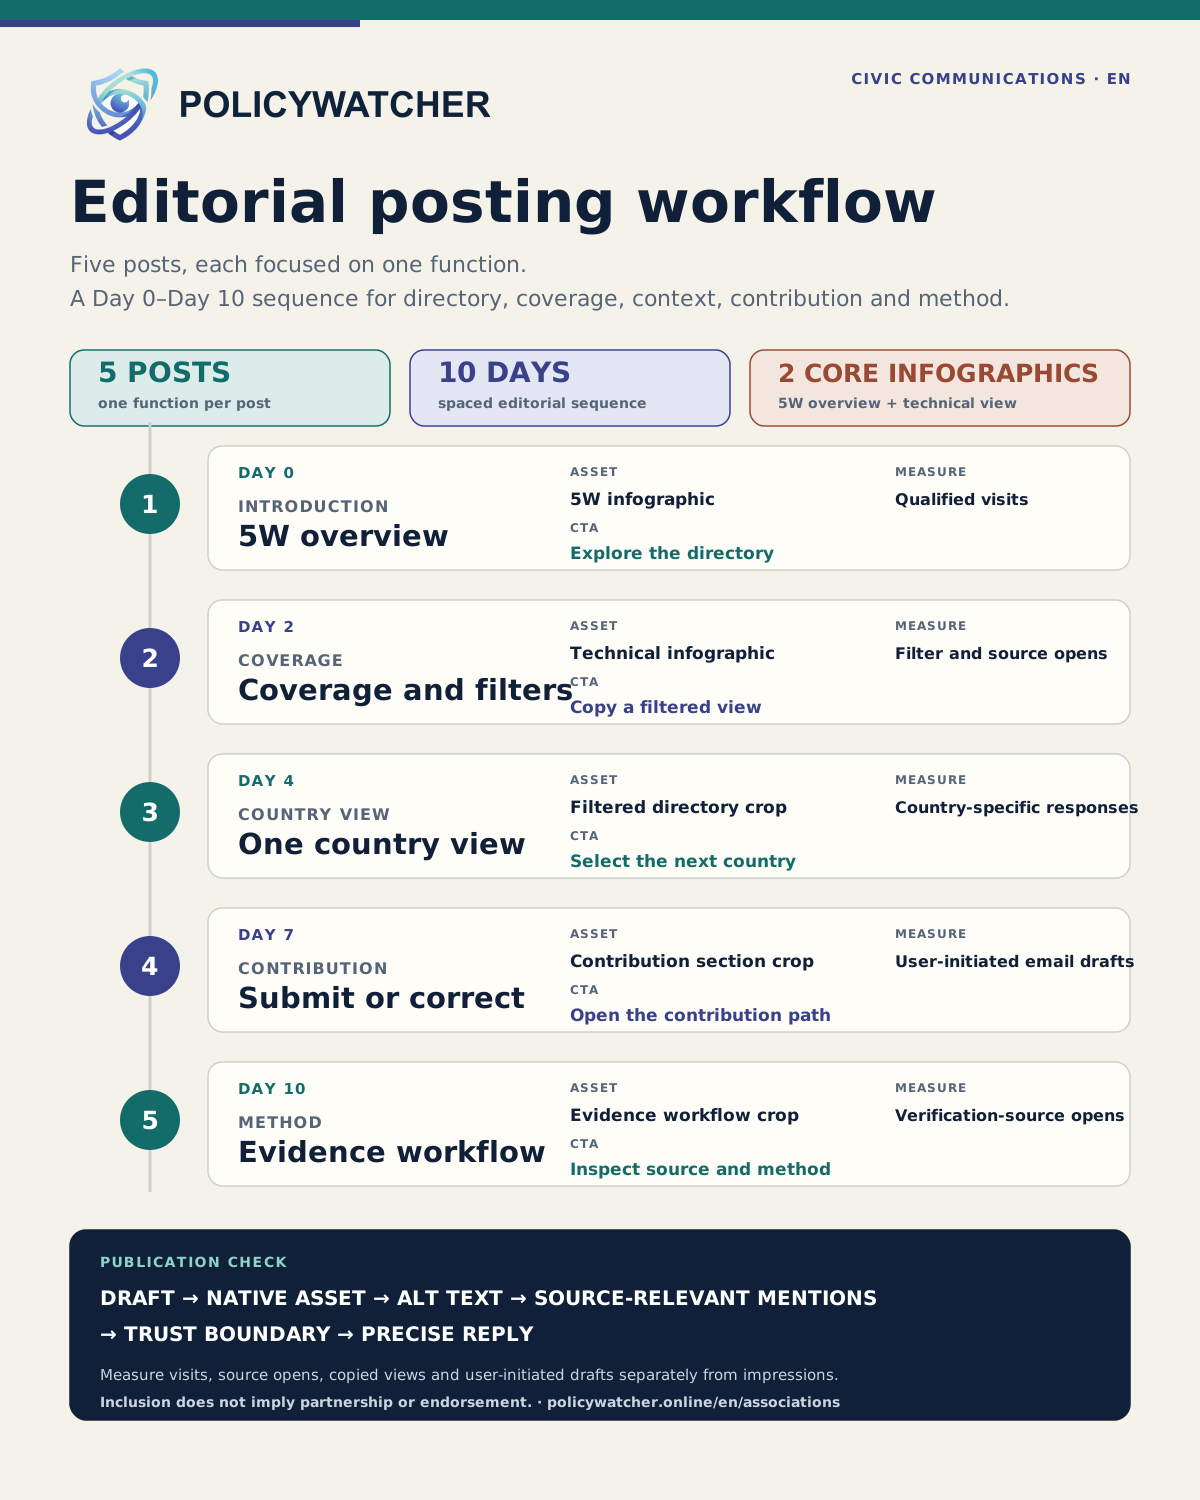
English PolicyWatcher Civic editorial workflow showing five posts from Day 0 to Day 10, with a named asset, call to action and measurement point for each post
Deterministic campaign workflow. Visits, source opens, copied views and user-initiated drafts are measured separately from impressions. Inclusion does not imply partnership or endorsement.
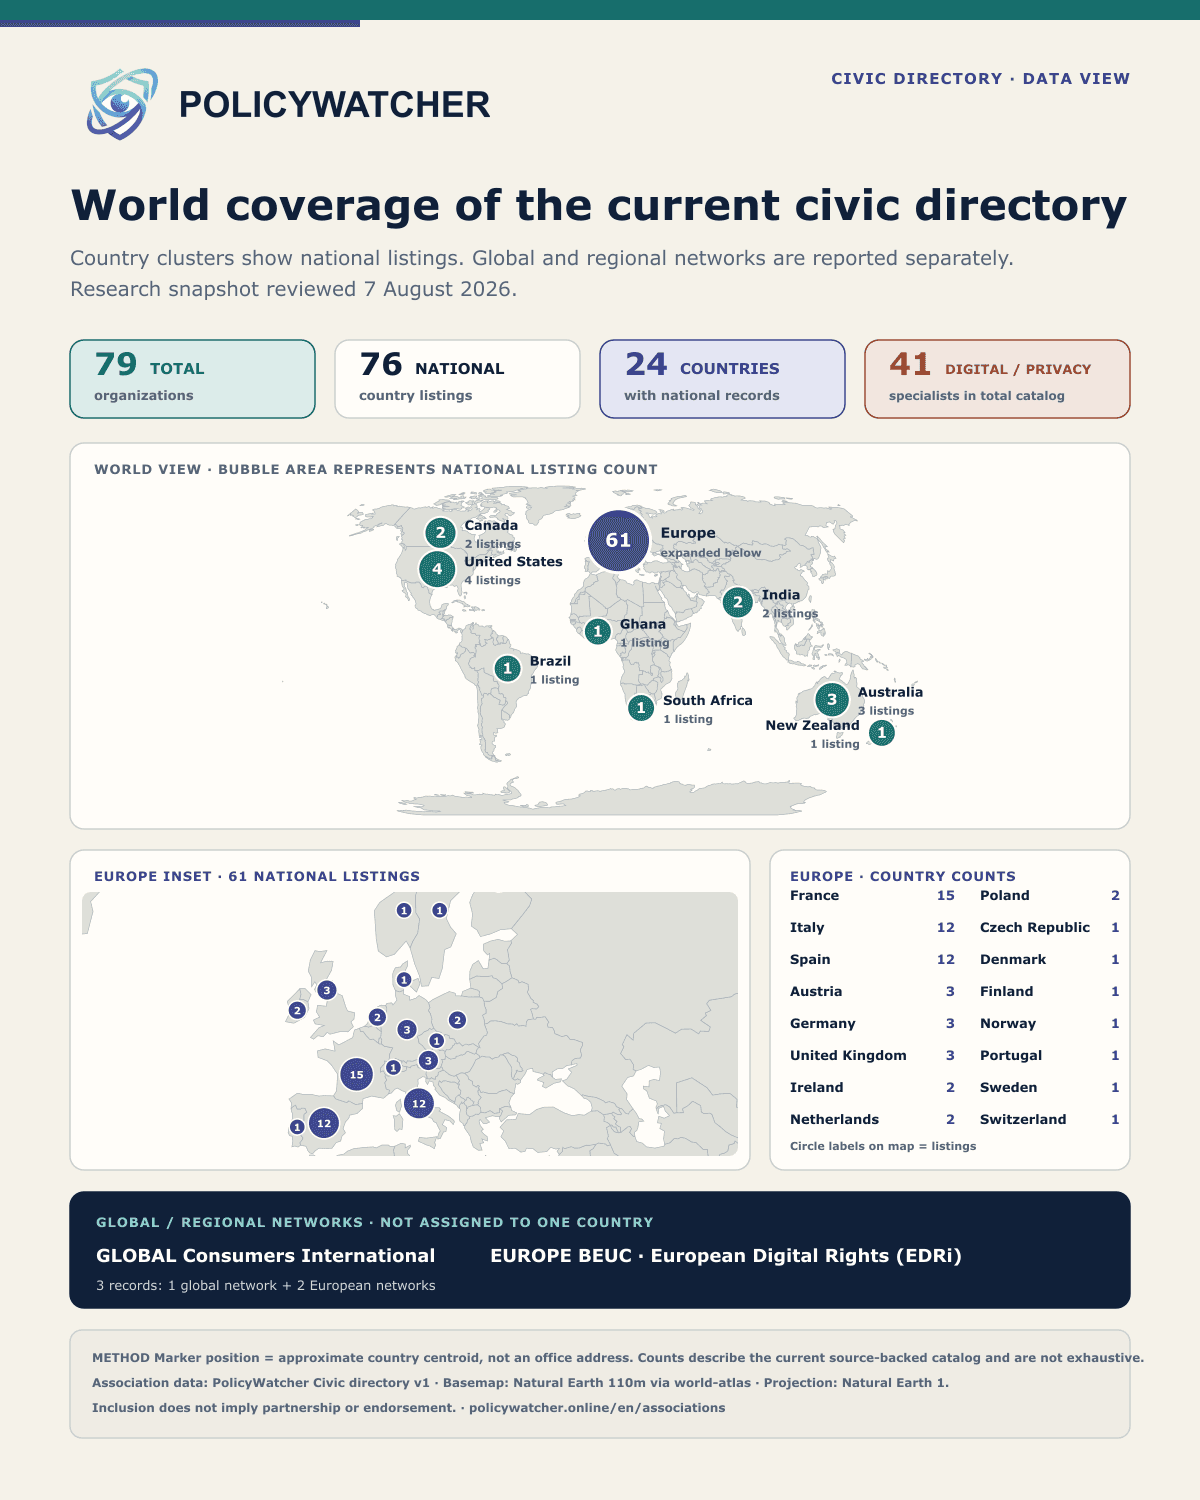
Infographic 08 · World coverage map · 18 August 2026

Consumer association coverage

A proportional-symbol world map derived from the directory: 76 national listings across 24 countries, with a Europe inset and the three global or regional networks reported separately.
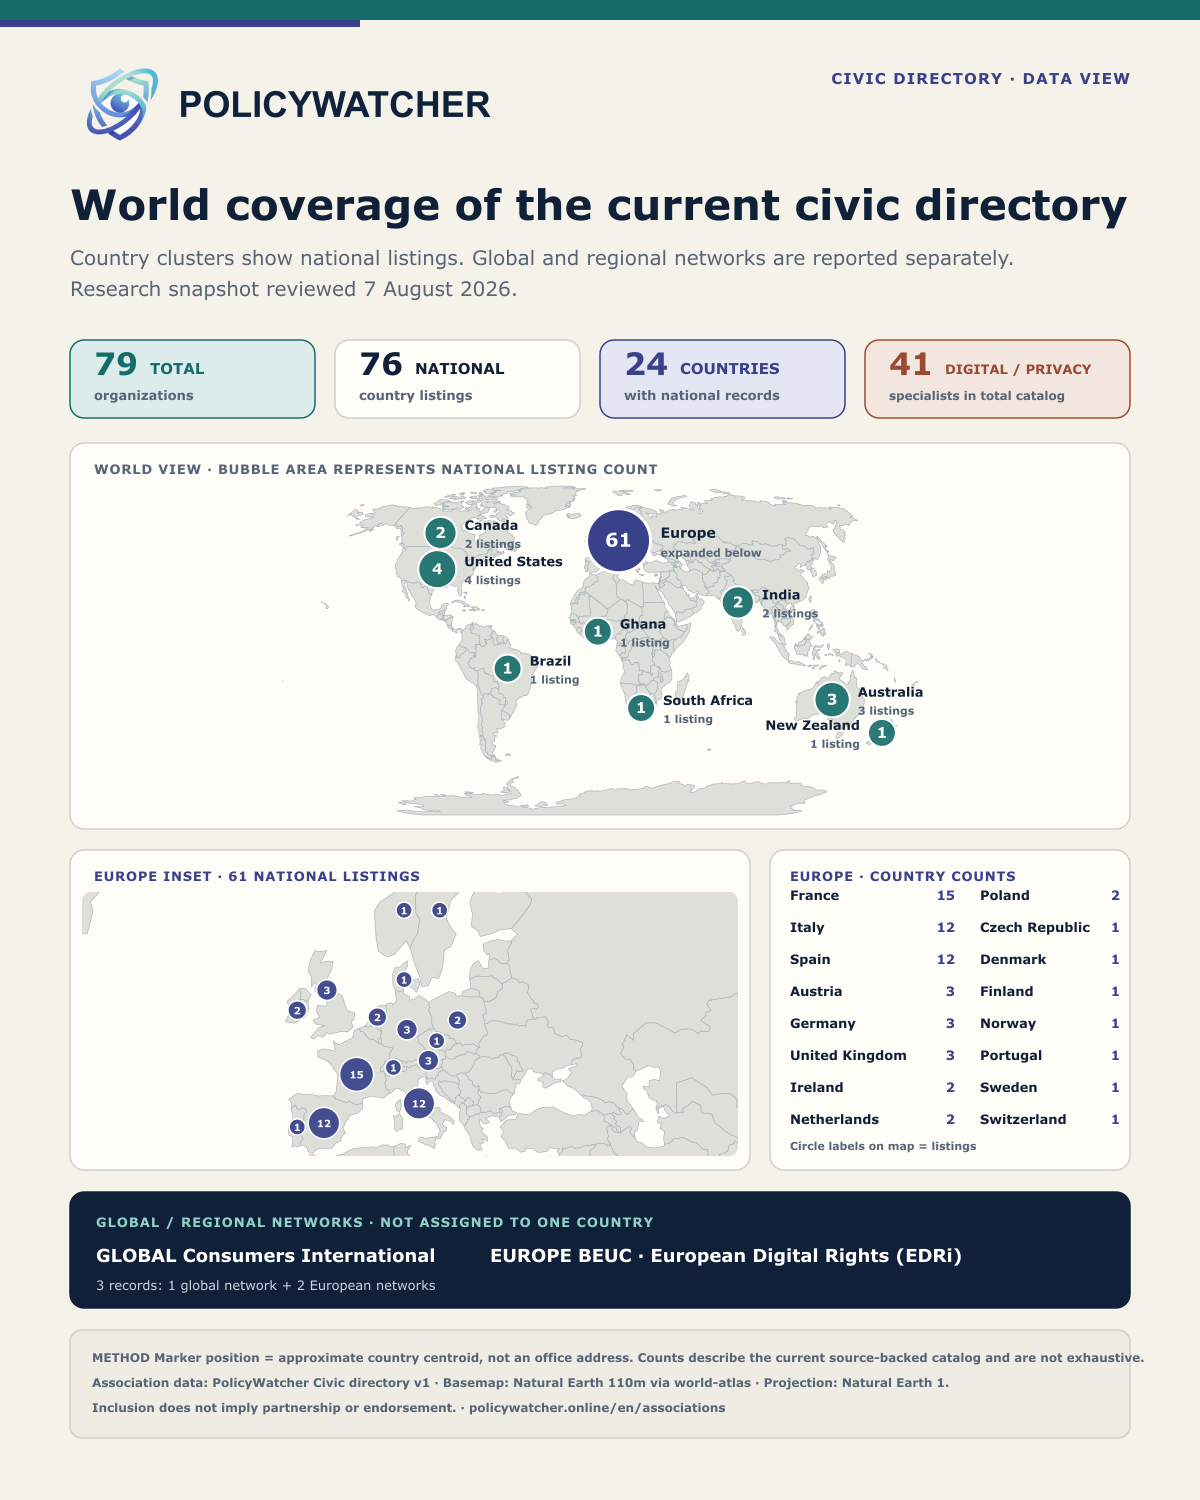
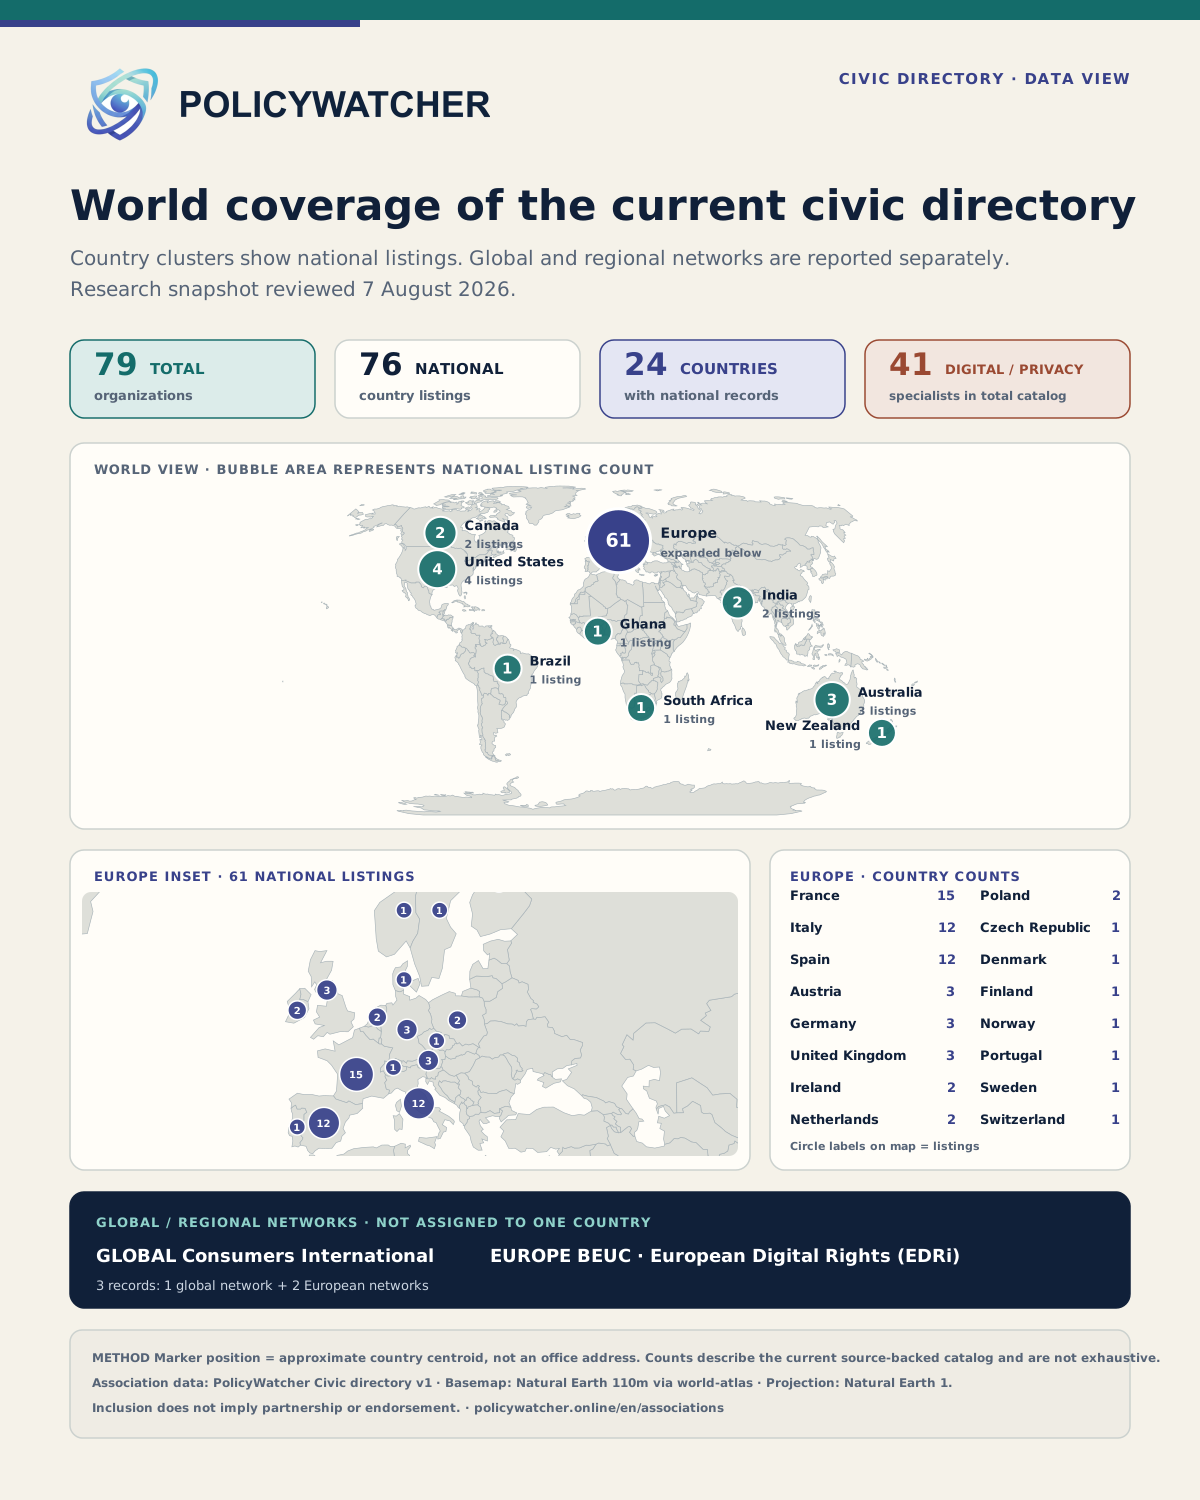
English PolicyWatcher Civic world coverage map showing 76 national association listings across 24 countries, a detailed Europe inset, and three global or regional networks outside the country counts
Country-level coverage view derived from the catalog reviewed on 7 August 2026. Marker positions are approximate country centroids, not office addresses; coverage is curated and not exhaustive.
Infographic 07 · PolicyWatcher Civic 5W · 18 August 2026

Global civic workflow

The English launch visual explains the audience, scope, geographic model, research date and evidence-first purpose of the global directory, with direct paths to explore, submit and correct.
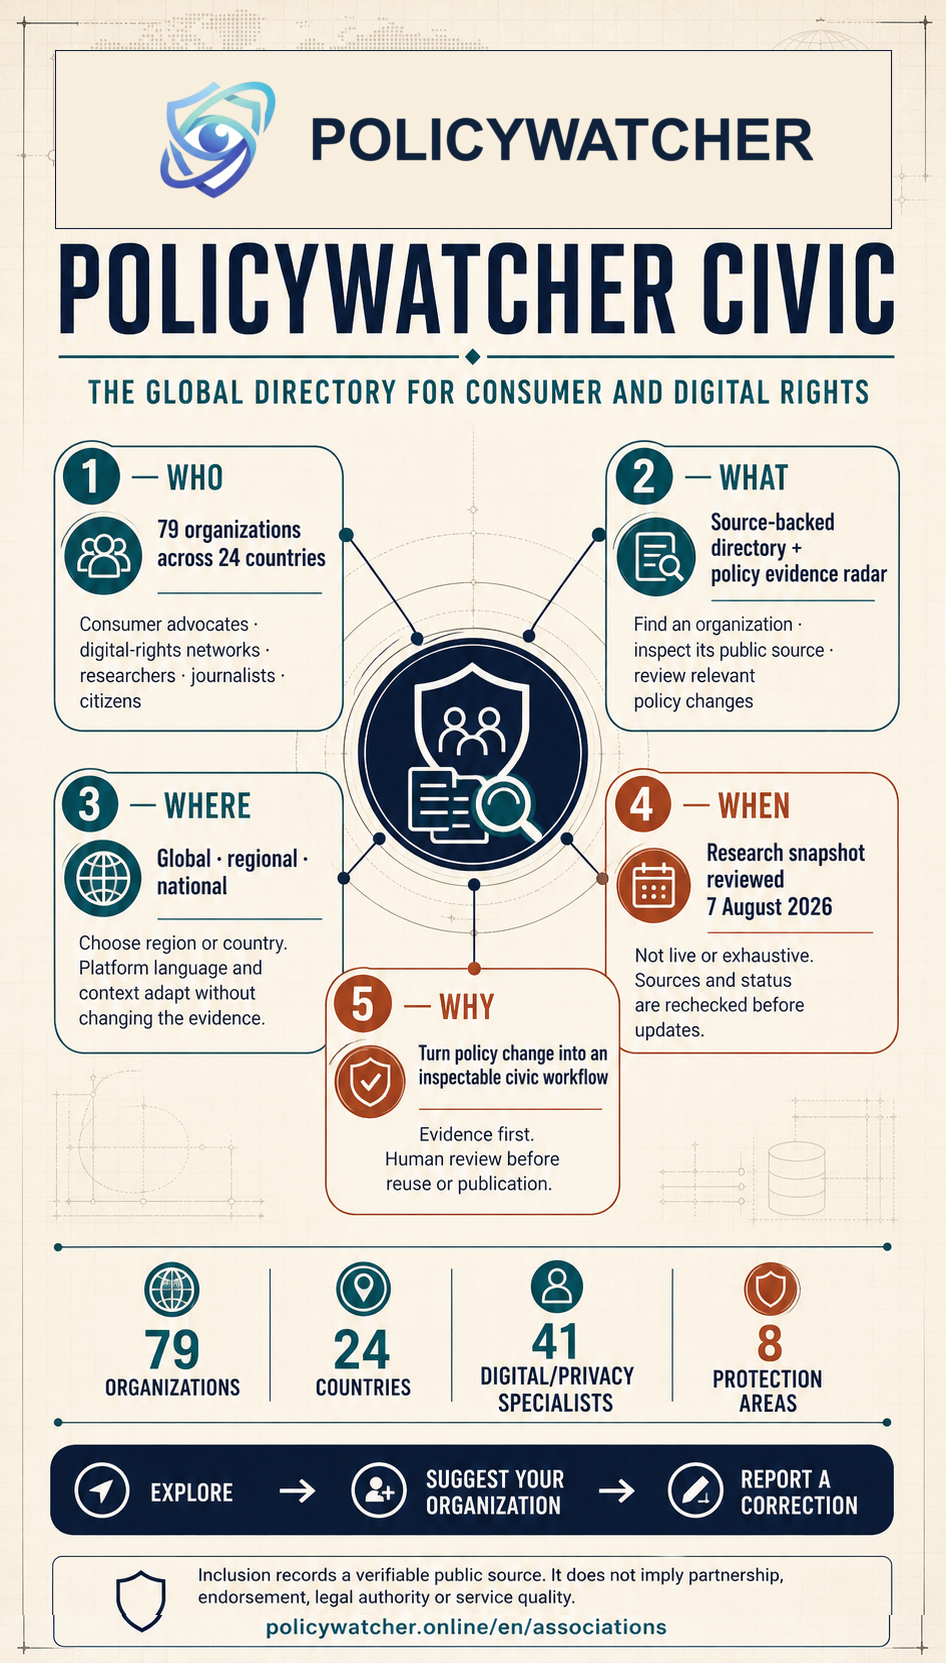
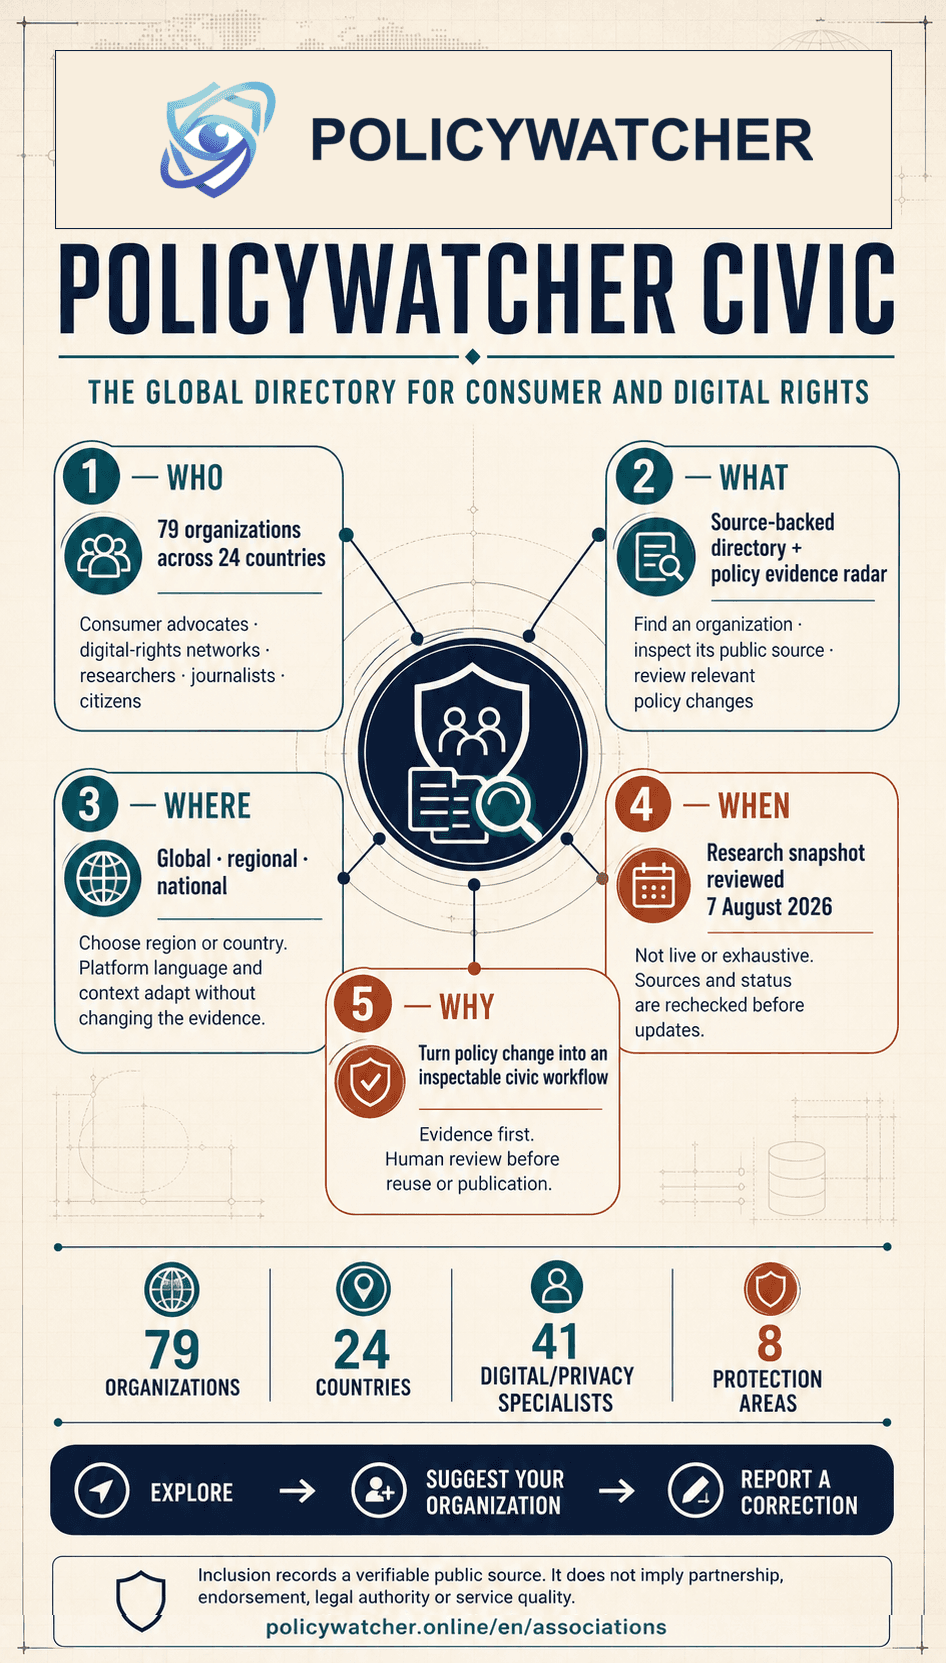
English PolicyWatcher Civic 5W infographic with the official PolicyWatcher logo, explaining who the global directory serves, what it provides, where it operates, when its research was reviewed and why the evidence workflow exists
AI-generated editorial visualization grounded in the catalog snapshot reviewed on 7 August 2026. Inclusion records a verifiable public source; it does not imply partnership, endorsement or legal authority.
Infographic 06 · Technical coverage · 18 August 2026

Civic review controls

The technical companion shows global, regional and national coverage; the eight protection types; shareable filters; the evidence workflow; and the separate paths for submissions and corrections.
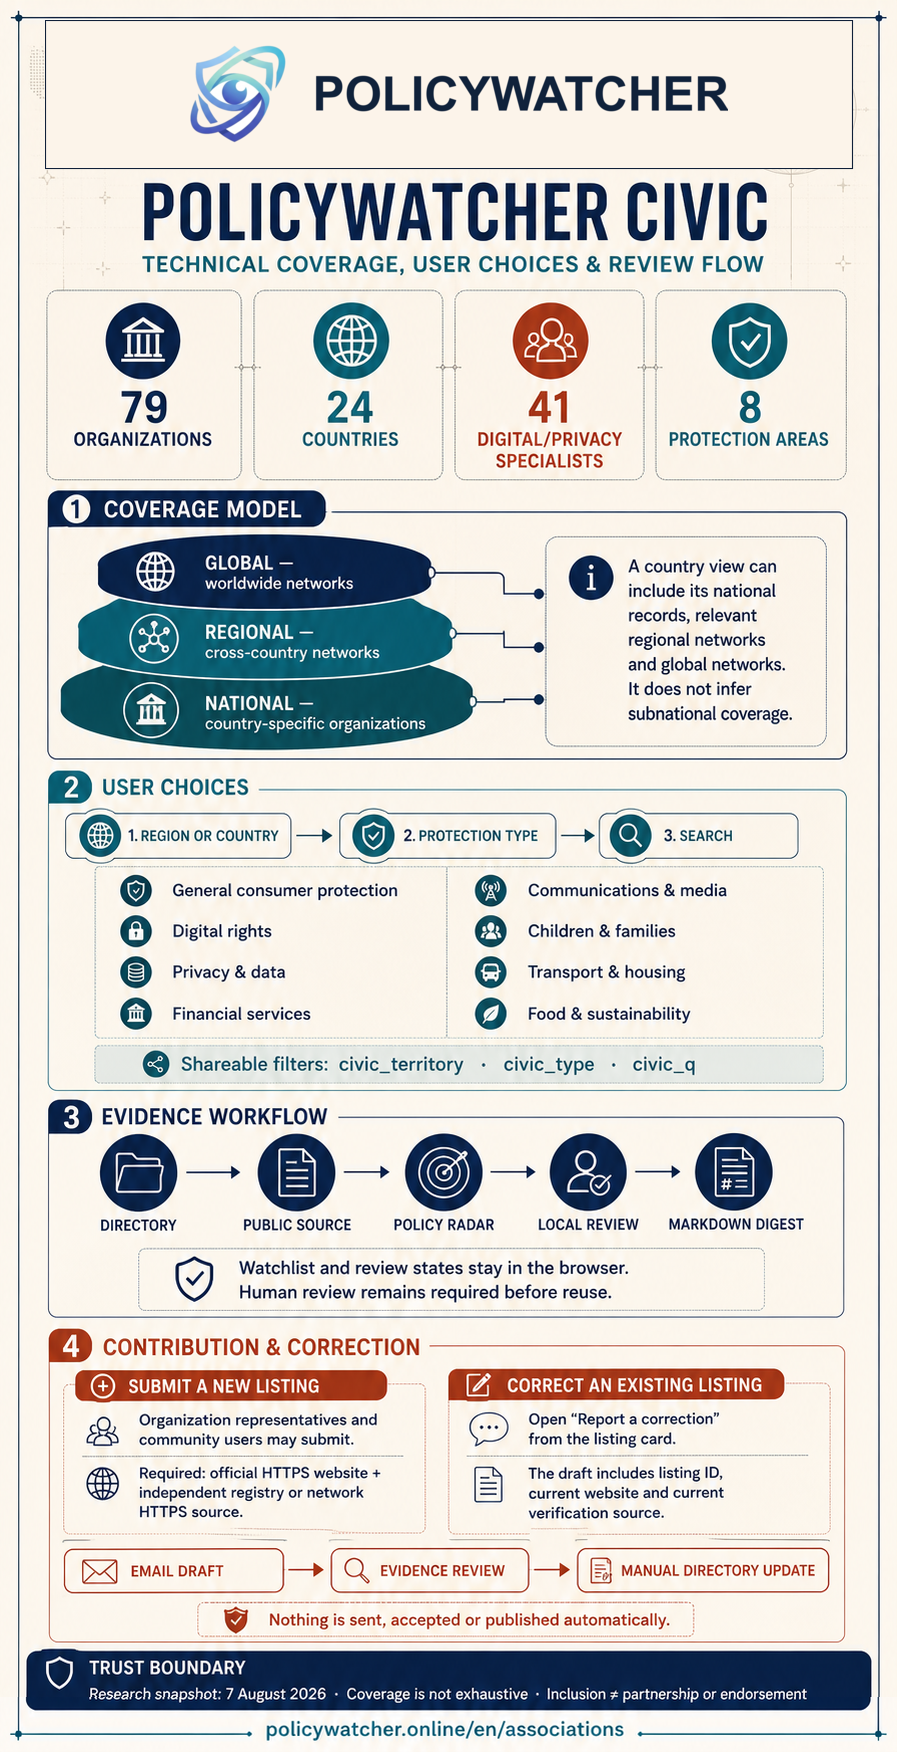
English technical infographic with the official PolicyWatcher logo, showing 79 organizations across 24 countries, coverage layers, eight protection filters, evidence workflow and controlled submission and correction paths
Detailed implementation view. Watchlists and review states remain in the browser; email drafts and directory changes require explicit human action.
Infographic 10 · Current v5.0.0 · August 2026

PolicyWatcher 4: what the operating-model change means

A sober English guide for product, governance, research and integration teams. It explains the 3.x to 4 evidence-model change first, then keeps architecture, Git, integrations and shared workflows in a separate technical mirror.
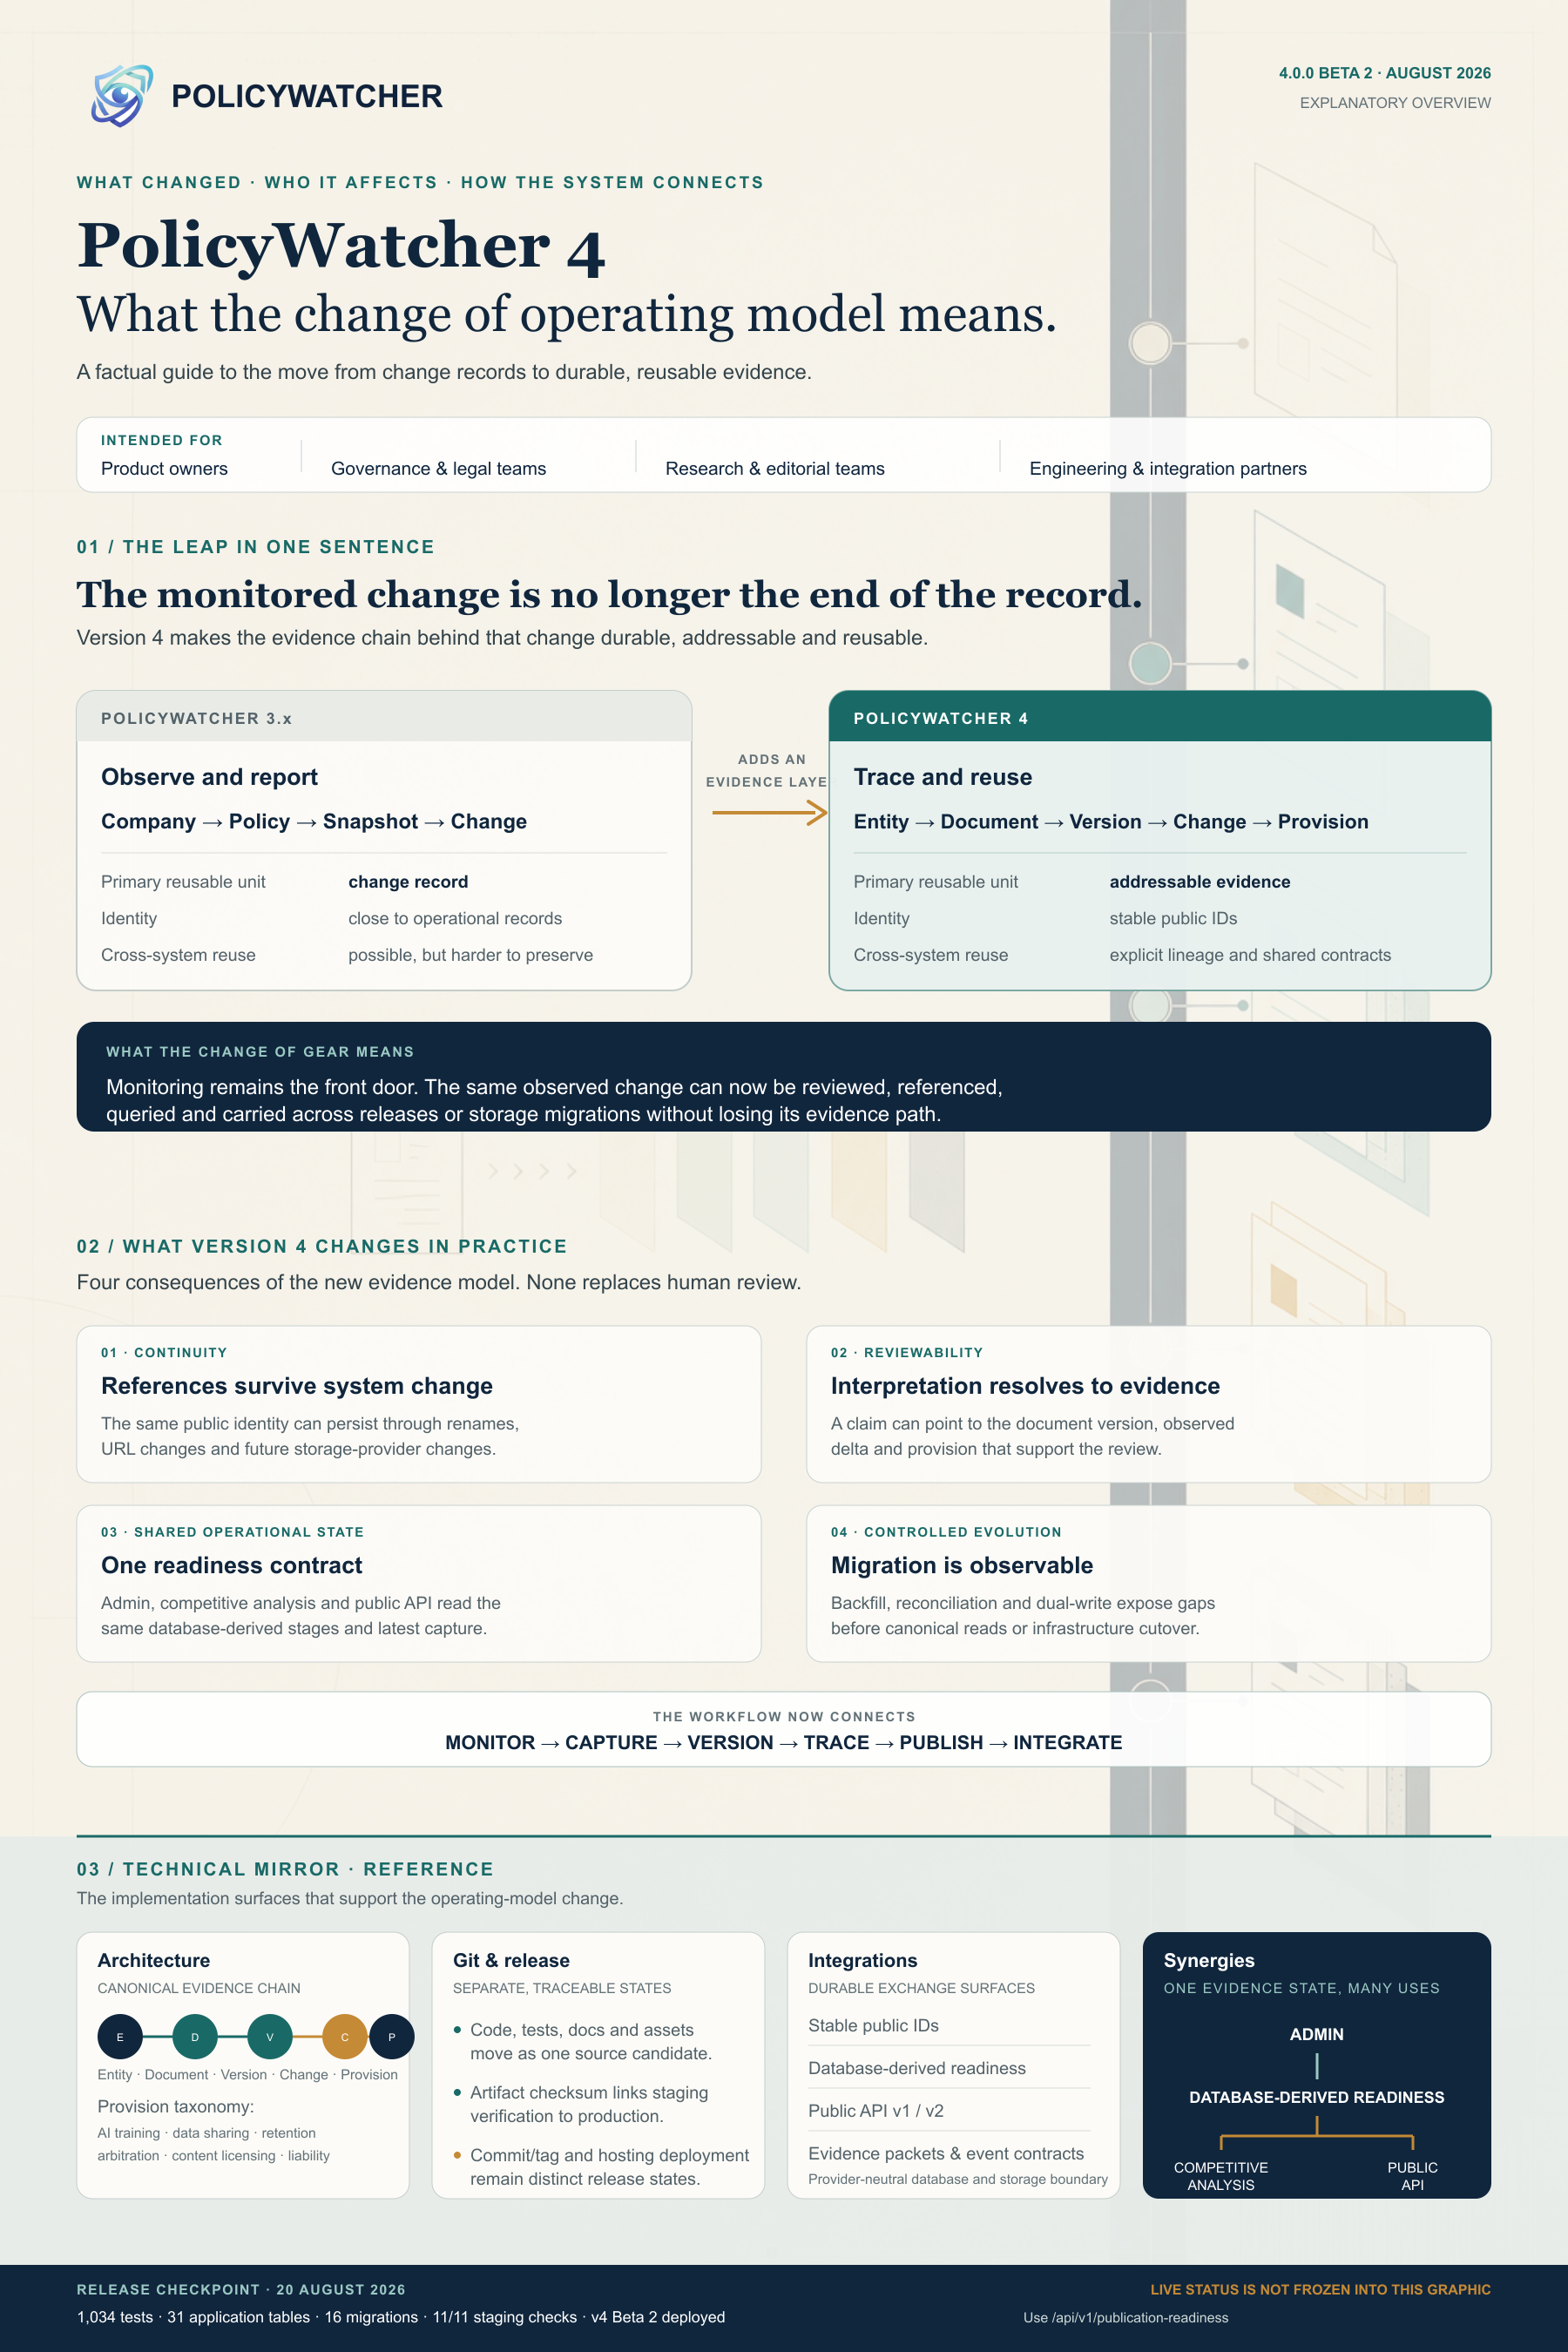
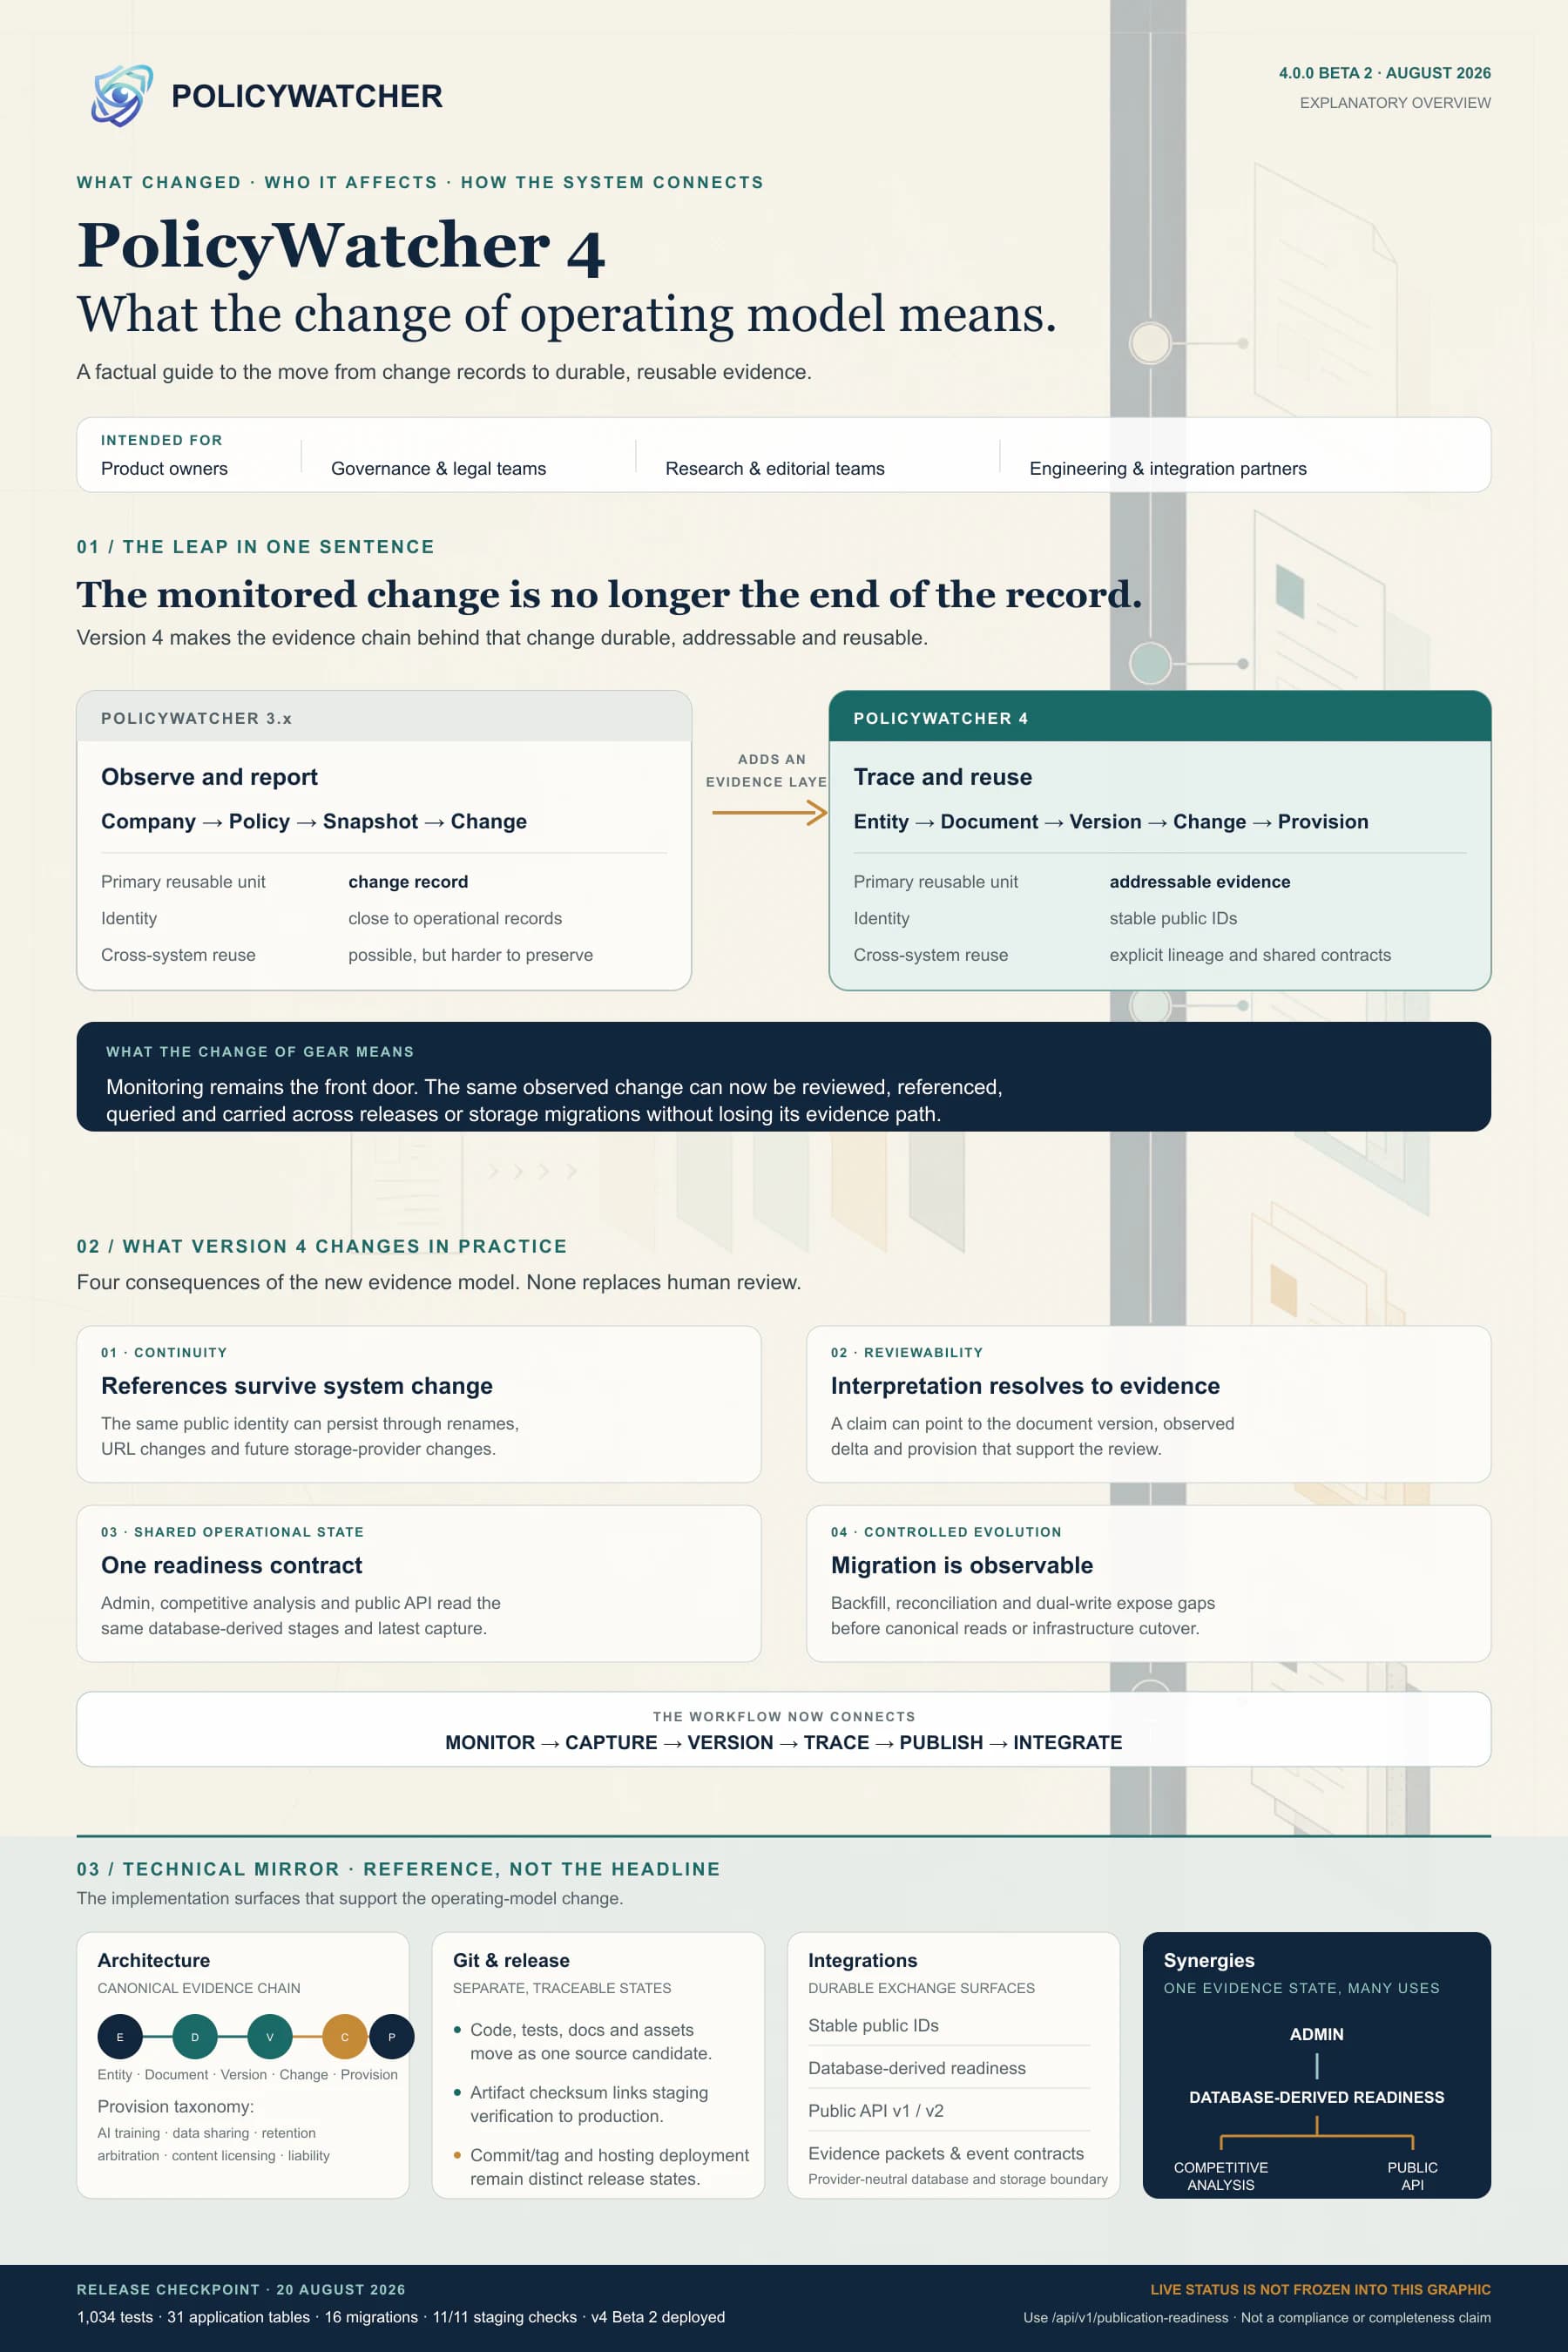
PolicyWatcher 4 operating-model guide for product, governance, research and integration teams, comparing 3.x change records with durable reusable evidence and placing architecture, Git, integrations and shared workflows in a secondary technical reference
Dated Beta 2 release checkpoint, not a claim of continuous availability, legal quality, corpus completeness, compliance or competitive superiority. Live readiness remains outside the static graphic. The illustration layer was generated with AI; every claim, number and label is deterministic.
Infographic 05 · Civic directory · 18 August 2026

Consumer association directory

The earlier Italian editorial poster presents the country-aware directory, eight protection areas, the evidence-to-digest workflow and the controlled path for suggesting another organization.
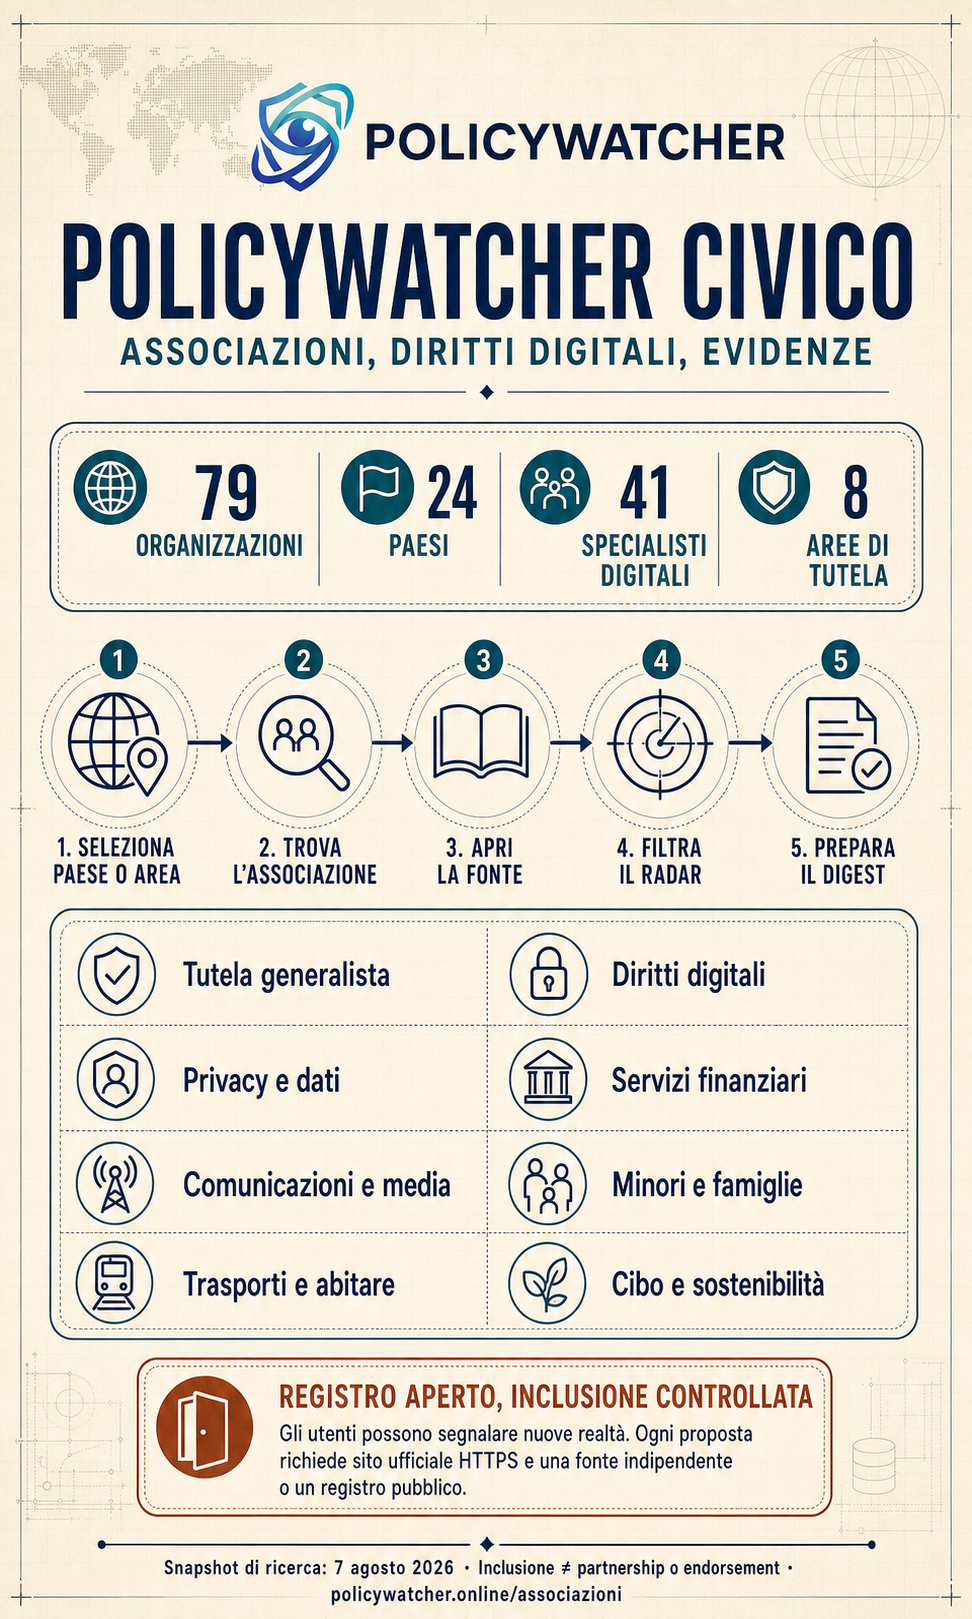
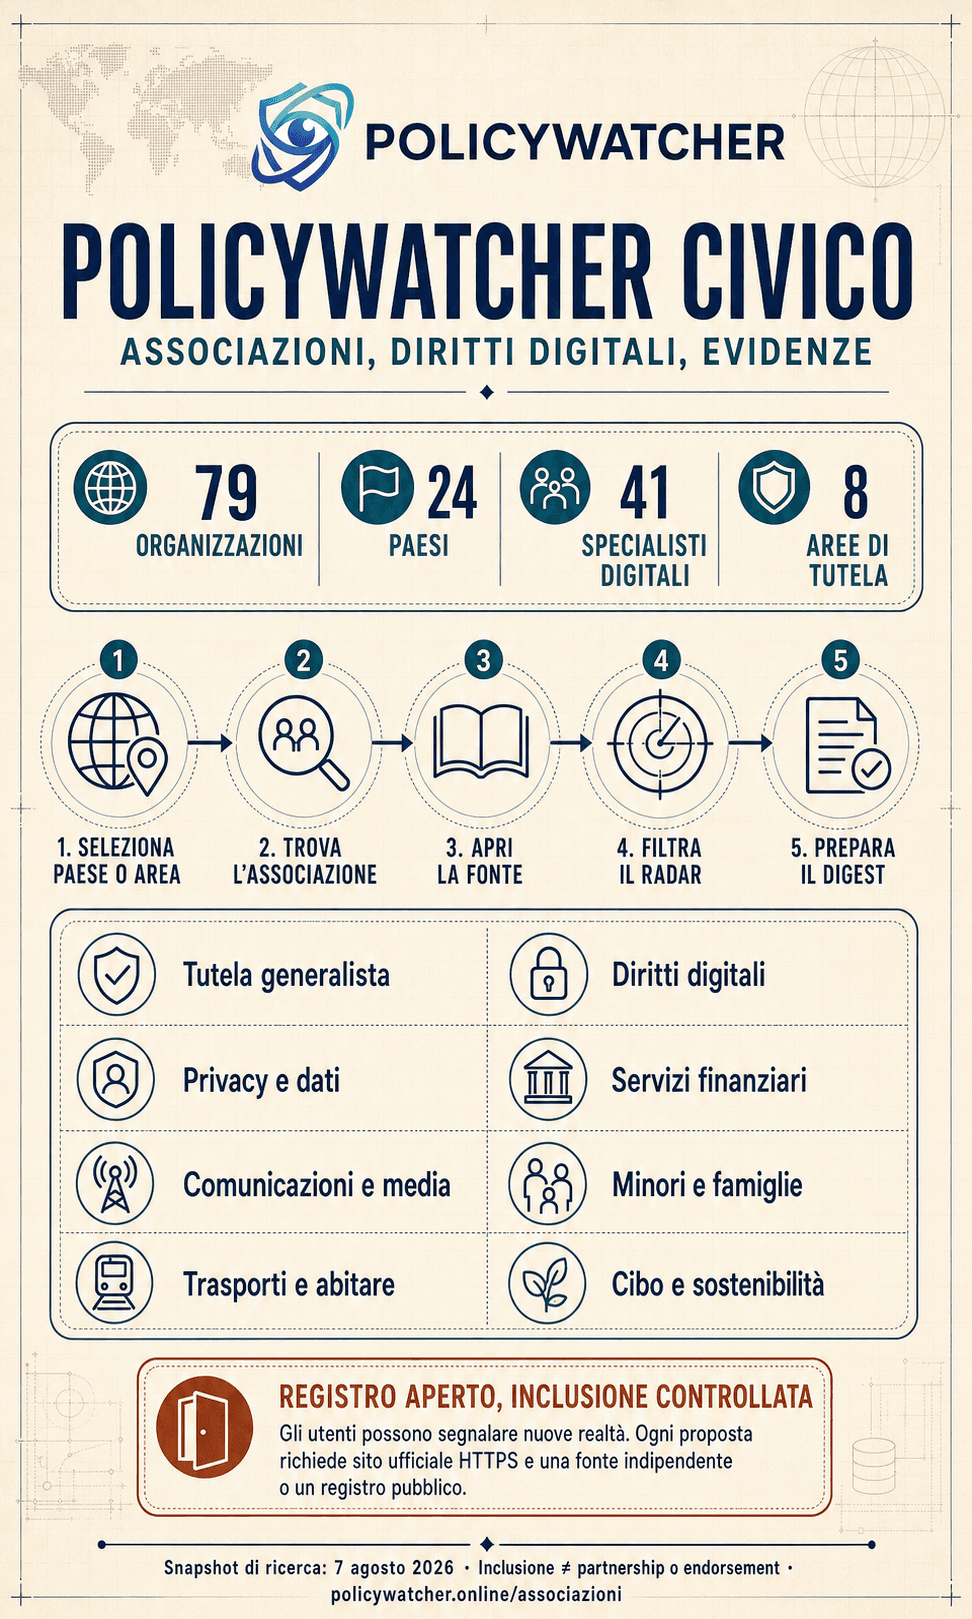
Italian PolicyWatcher Civico infographic showing 79 organizations in 24 countries, 41 digital specialists, eight protection areas and a five-step evidence workflow
AI-generated editorial visualization grounded in the catalog snapshot reviewed on 7 August 2026. Inclusion documents a public verification source; it does not imply partnership, endorsement or legal authority.
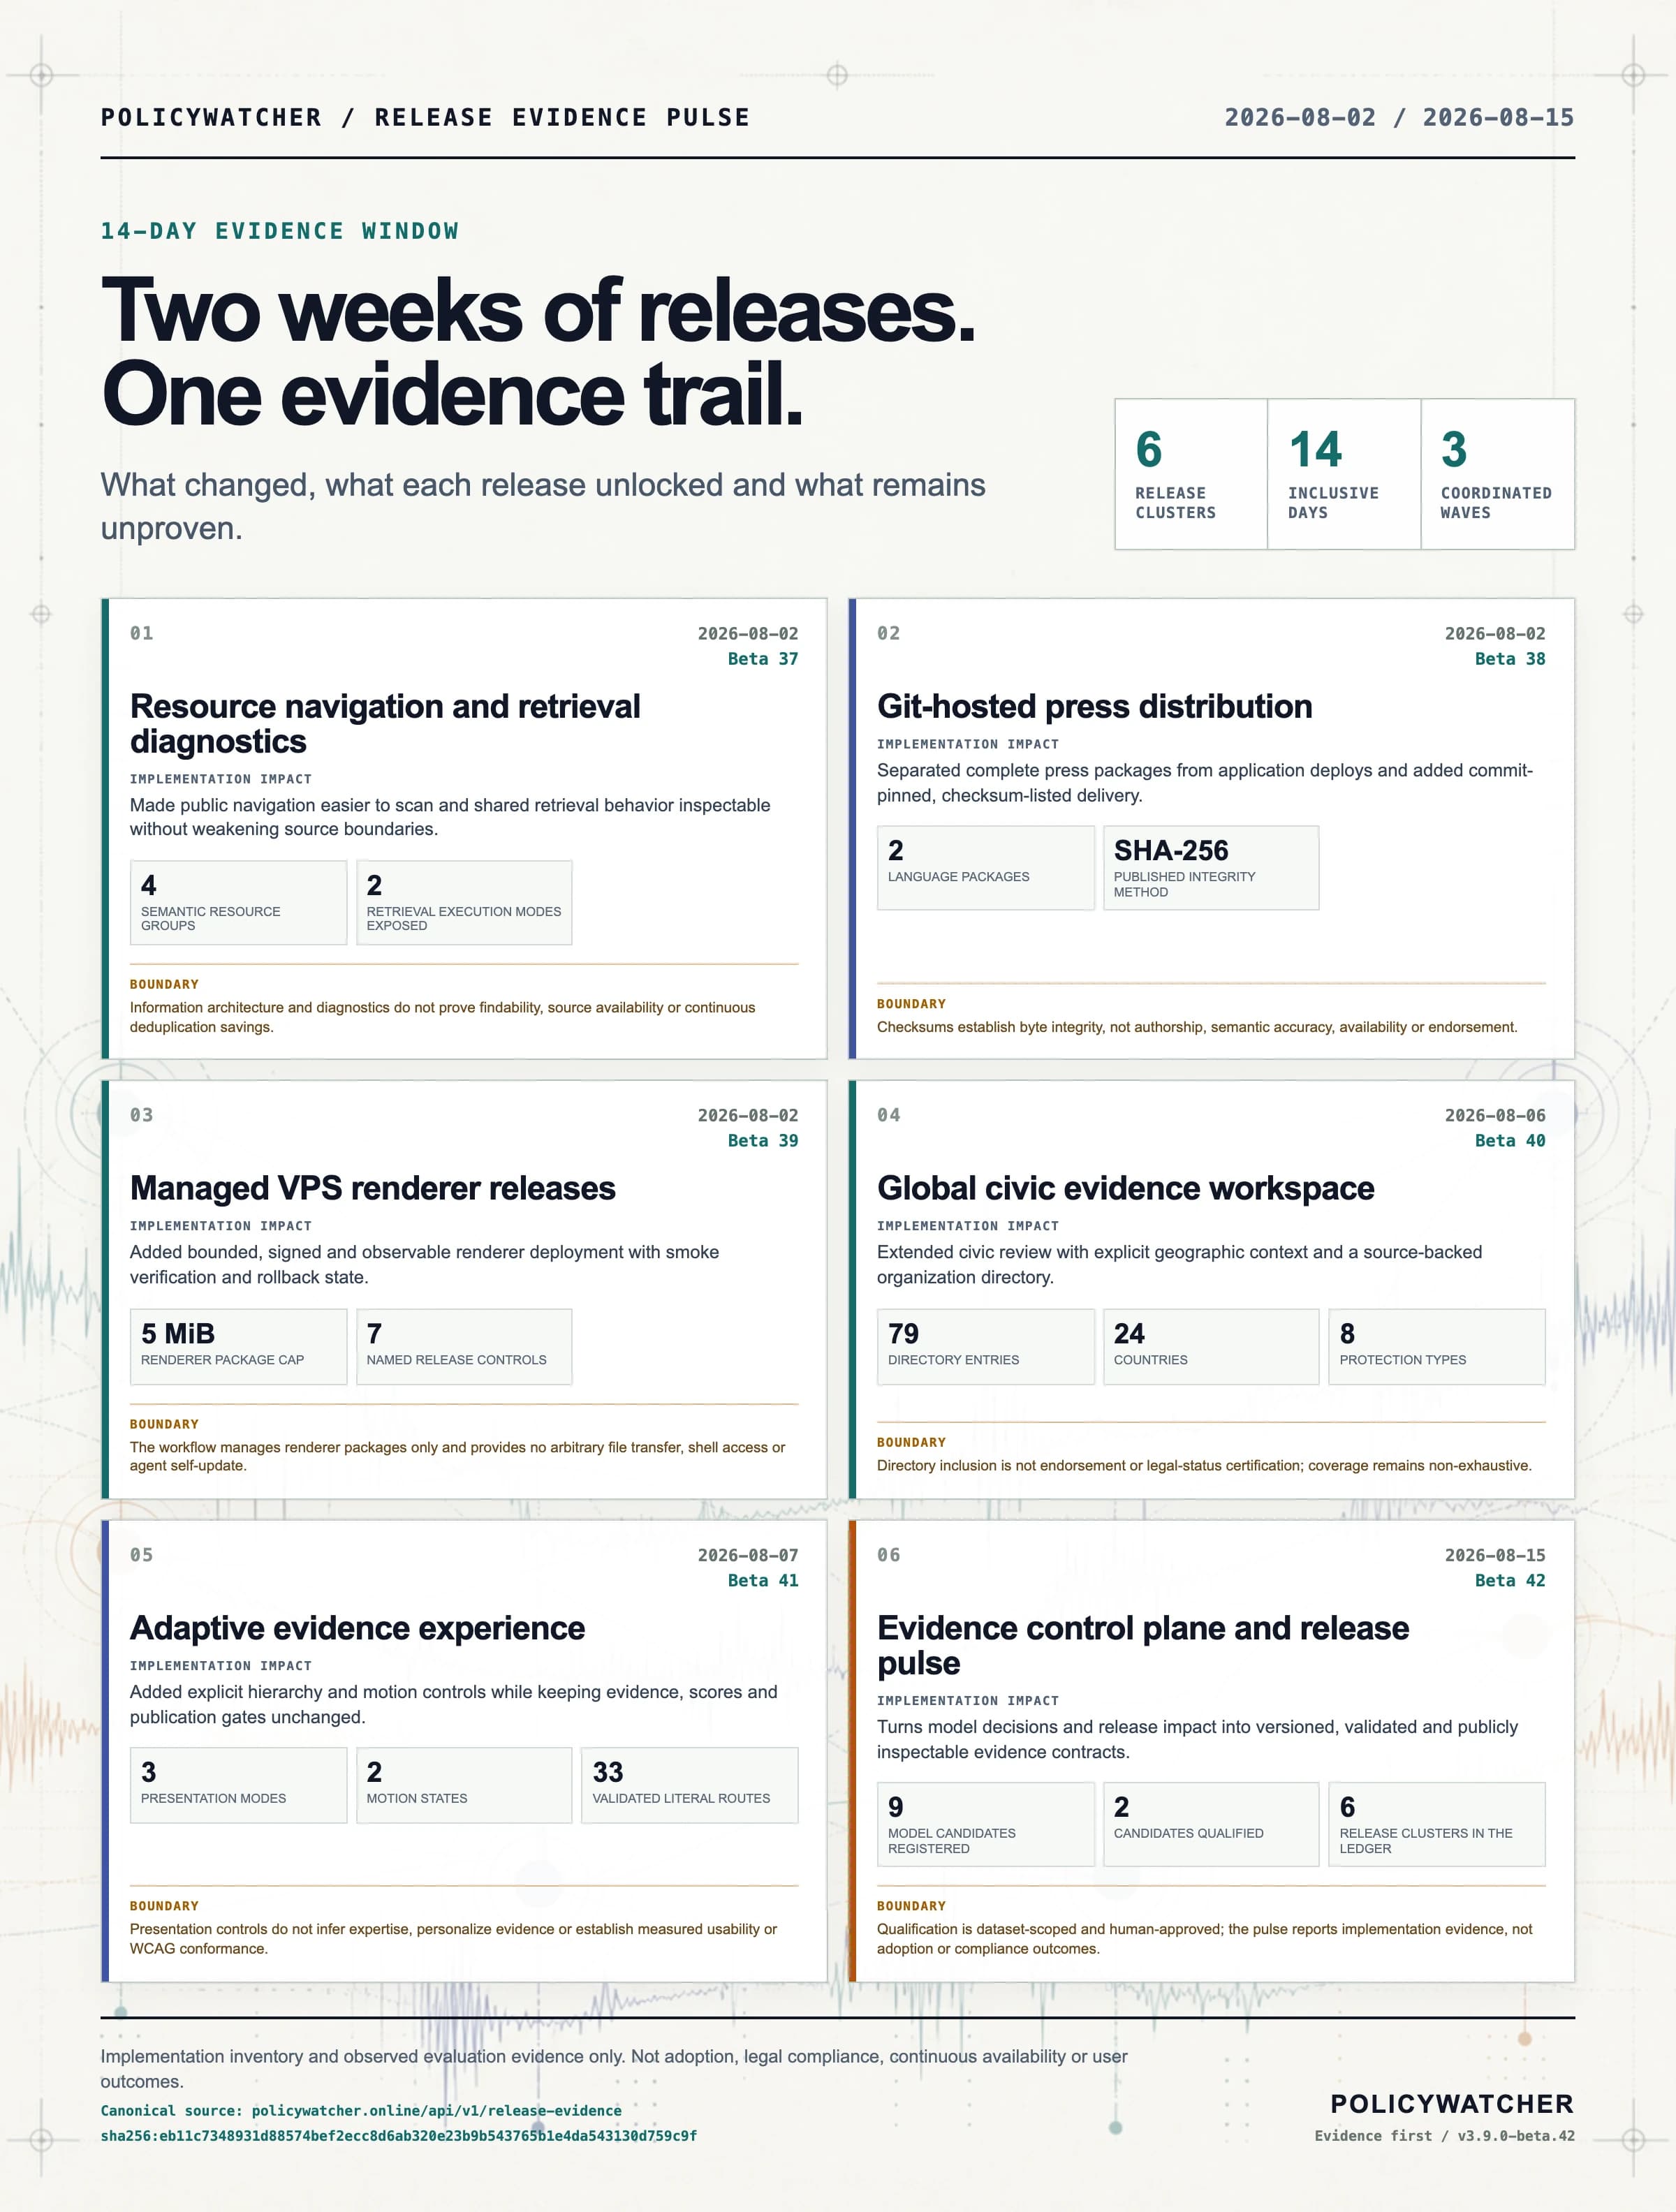
Infographic 04 · Release evidence · 2-15 August 2026

Release evidence

A bilingual press-ready record of the last fourteen days: what shipped, the implementation impact, the observable metric and the residual limit attached to every claim.
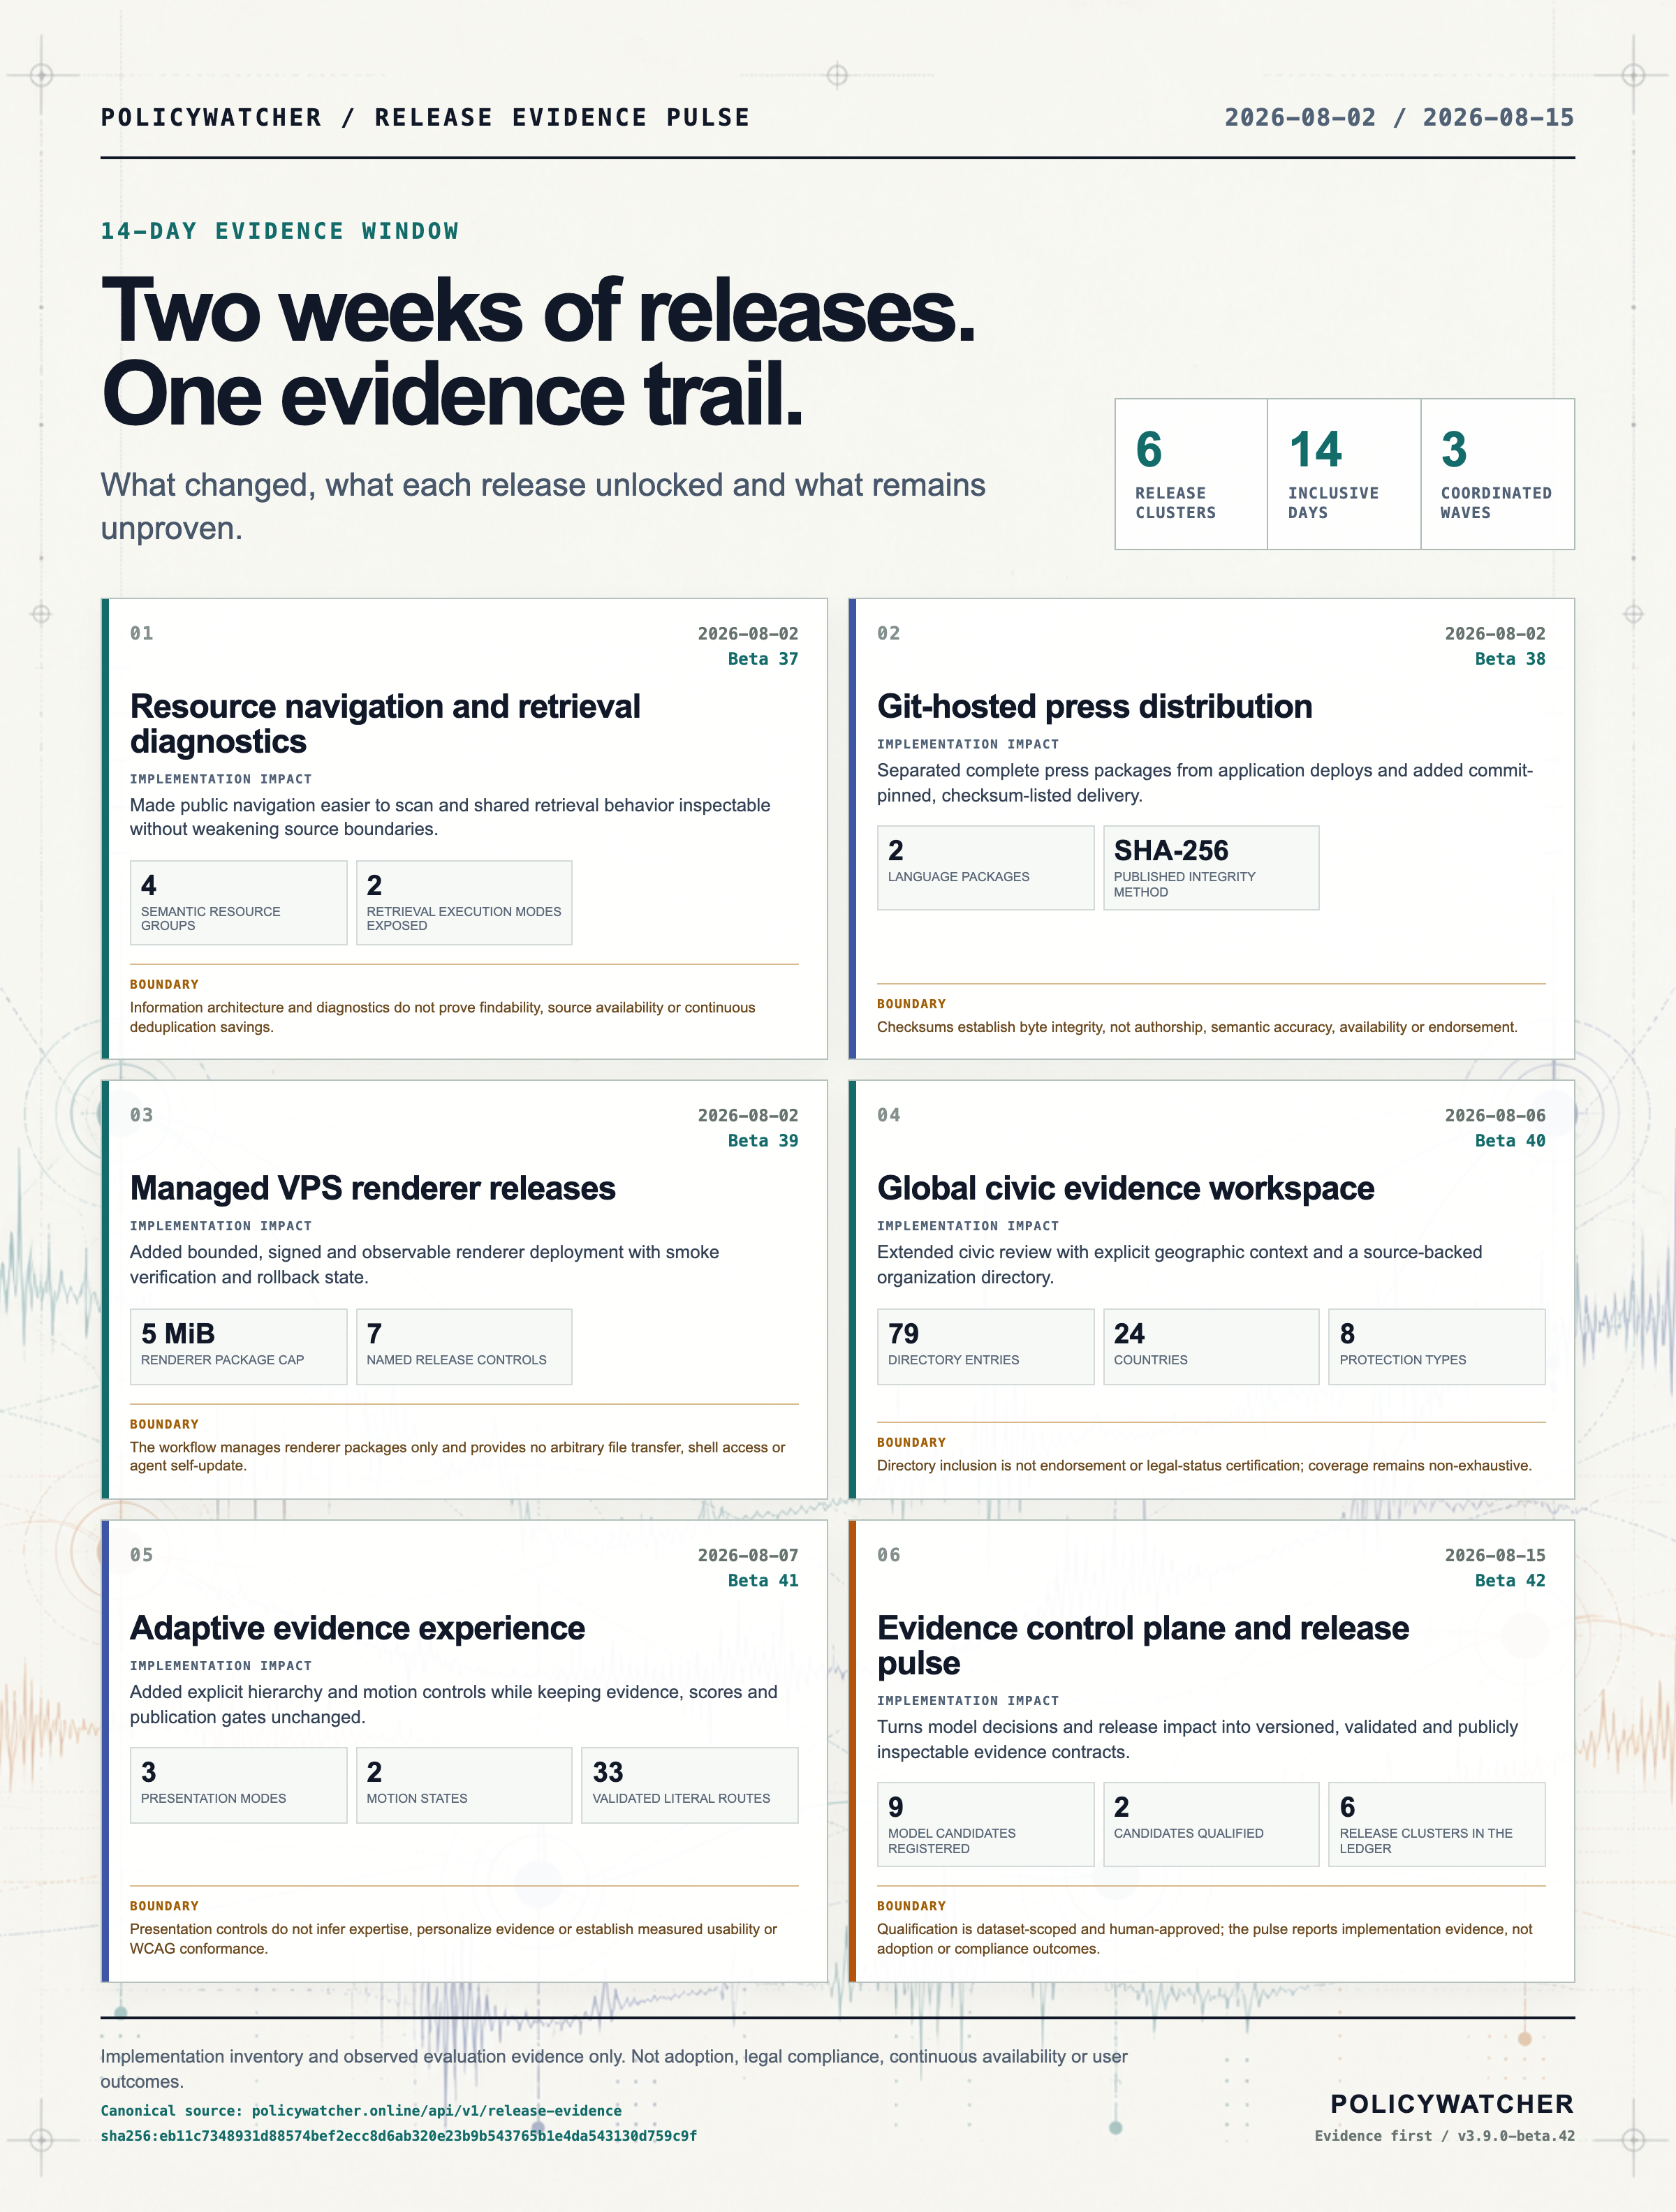
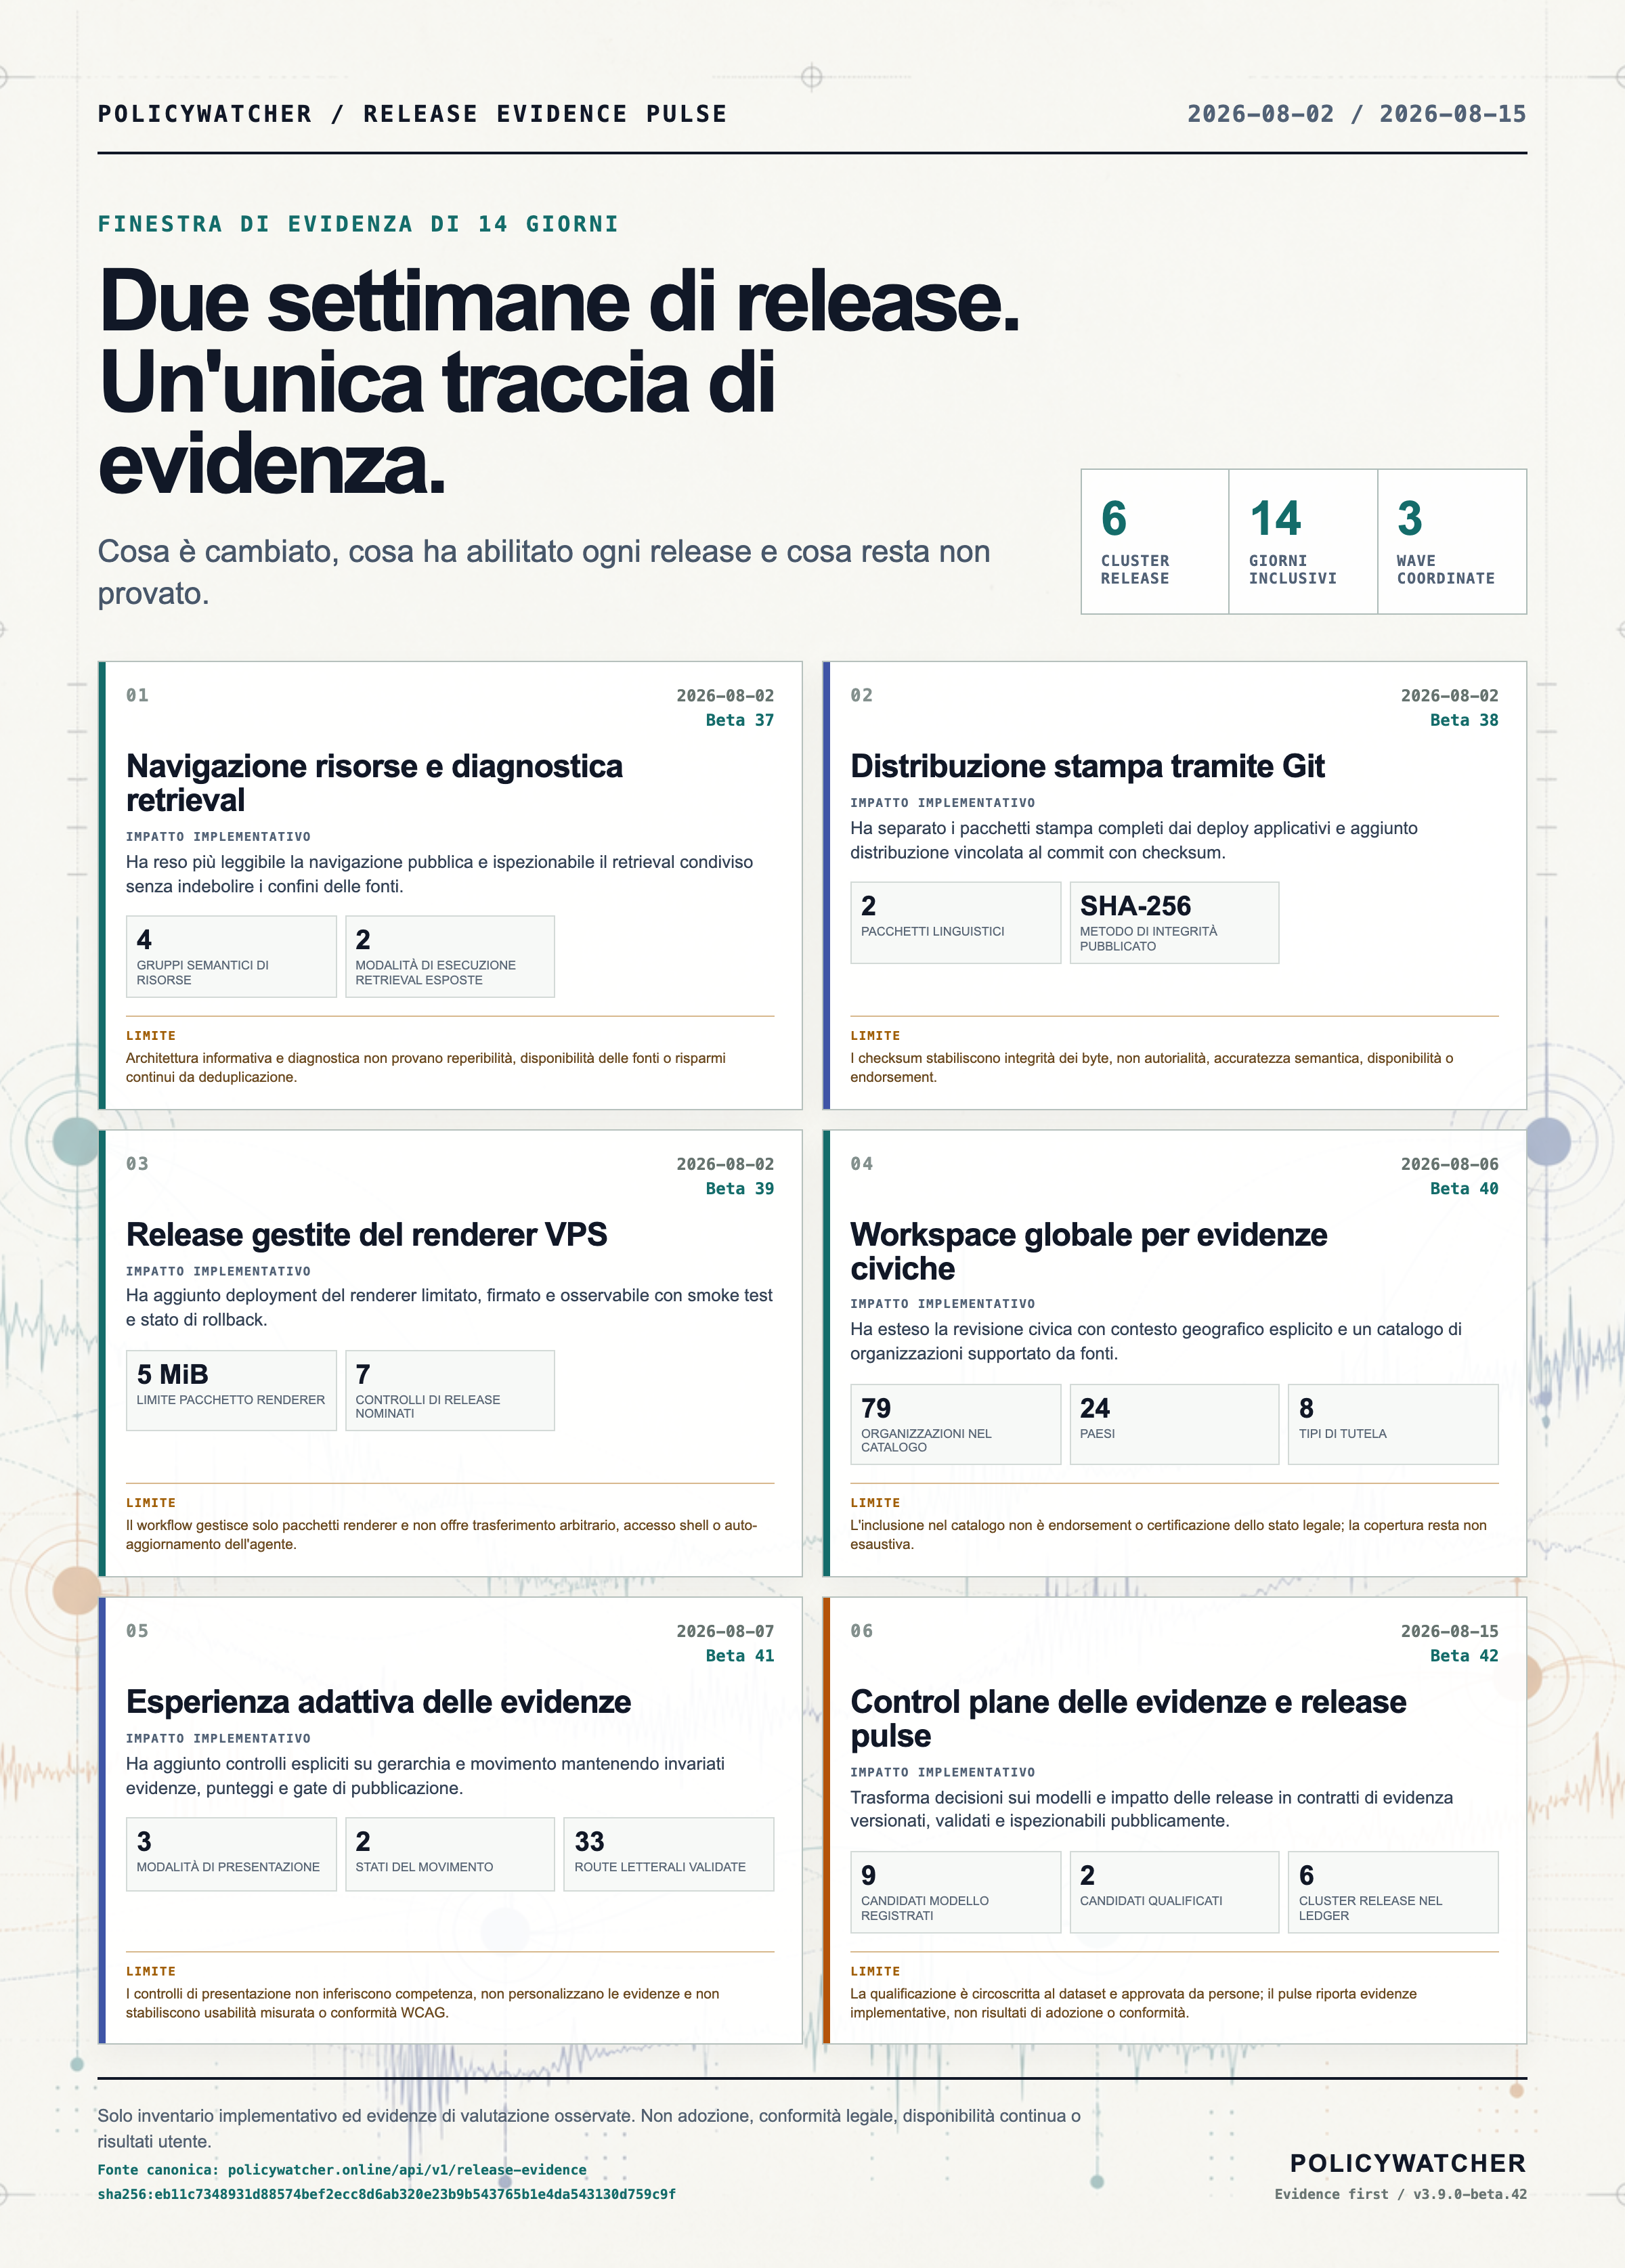
Six PolicyWatcher release cards with dates, implementation impacts, metrics and limitations for the fourteen days from 2 to 15 August 2026
Deterministic rendering of the public release evidence ledger. Implementation inventory, not measured adoption or compliance. The decorative background was generated with AI and is disclosed in the Press Kit metadata.
Infographic 00 · ER sitemap · August 2026

Site map model

A source-backed map of 33 static sitemap entries, seven editorial domains and four dynamic entity families. Region, language and workspace orient the experience without changing evidence gates.
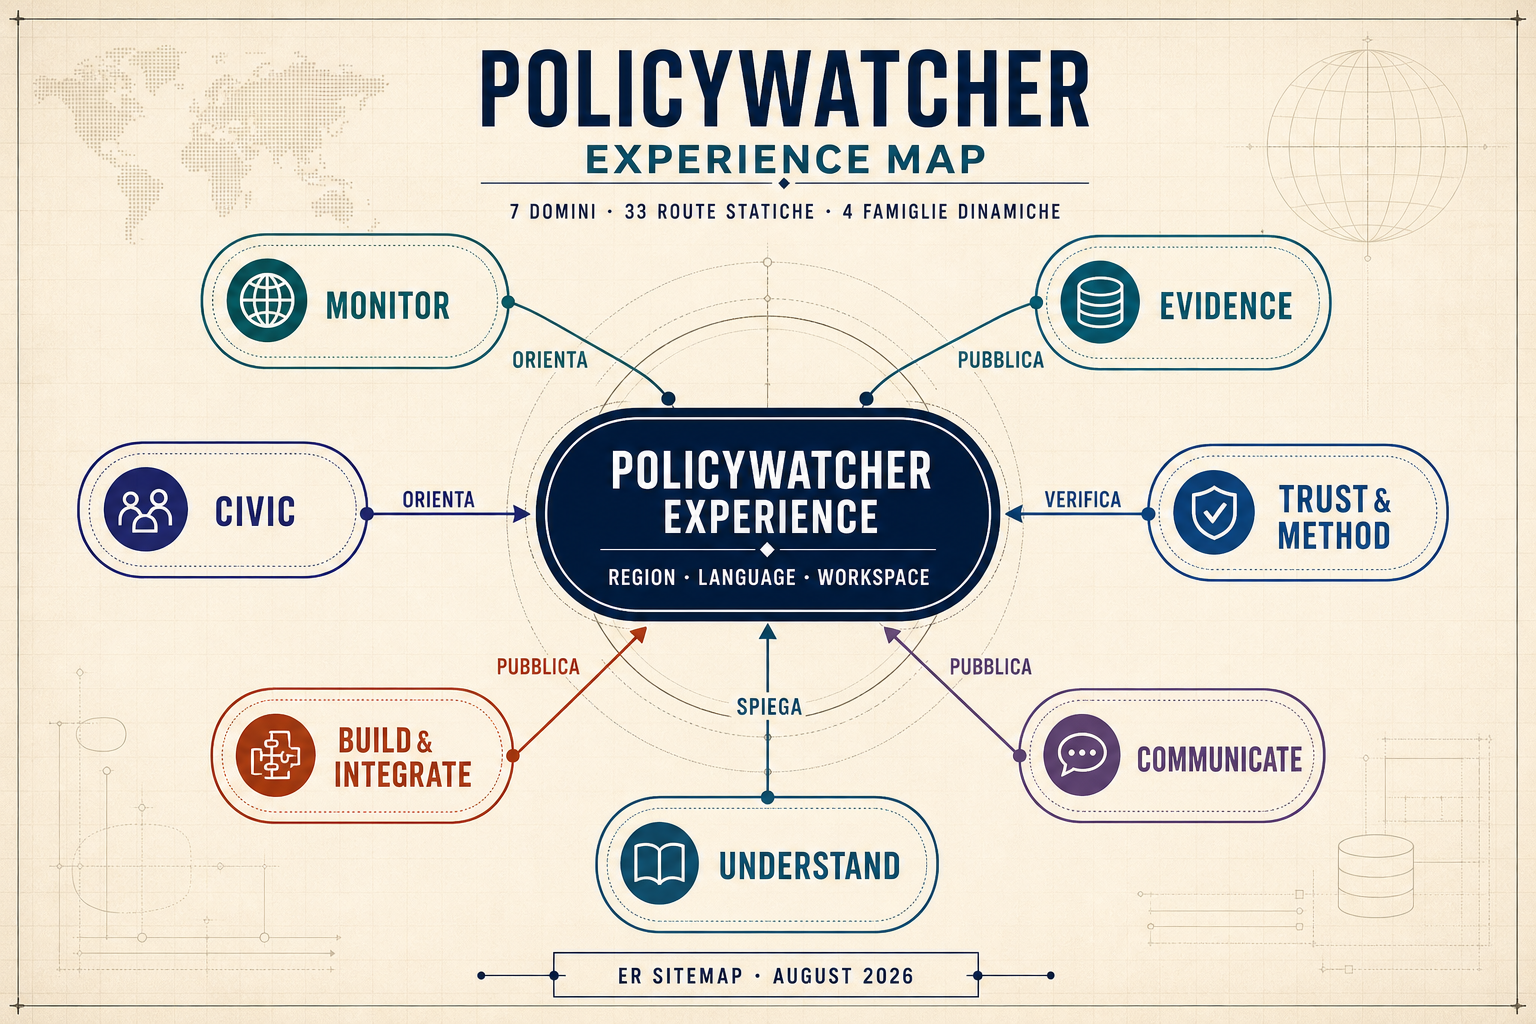
PolicyWatcher entity relationship sitemap with a central global experience connected to Monitor, Evidence, Civic, Trust and Method, Build and Integrate, Communicate, and Understand domains
Editorial poster generated from the ER taxonomy. Exact routes and relations remain documented in the machine-readable sitemap inventory.
Infographic 01 - Interactive

Adaptive Workspace Matrix

When a user selects a role, the workspace composer filters and reorders modules dynamically. Canonical links preserve committed public view state, while regional and KPI modules coordinate context with exact-value fallbacks. Select a lens tab to preview which modules activate:

Choose Workspace Intent
Active Modules List
Safety Banner (Suspended Sources)
Market Pulse (AI Briefings)
Company Cards Grid
Natural Language Summaries
Dataset QA & Confidence Badges
Evidence KPI Matrix
Canonical Shareable View State
Regional Context Drill-down
Benchmark KPI Inspector
Chronological Policy Timeline
Policy Signals Board
Protected API Operations
VPS companion diagnostics
Mobile diagram key
Safety banner
Required by each registered workspace intent.
Solid module
Active in the selected GRC workspace.
Faded module
Available elsewhere, deprioritized for this intent.
Share and drill-down
Canonical view state, atomic regional context and exact KPI inspection remain evidence-bound.
Infographic 02 - Interactive Sitemap

Sitemap & Section Atlas

The new build introduces structured categories. Click on any node in the relationship graph below to explore its description and role:

Selected Atlas Node Details
Evidence ConsoleCore Workspace

Main public dashboard equipped with the dynamic workspace composer, filters, QA state, and monitored companies.

→ Feeds policy changes into the Timeline and compares readiness on the Signals Board.
DASHSHOWTIMELEADTRSTMAPADM
Infographic 03 - Safety Invariant

Safety Invariant & Filter Pipeline

When initializing parameters, PolicyWatcher validates queries against a strict schema. Regardless of the active view or lens details, any detected data warnings are forced to render through a locked safety bypass.

Control pipeline logic
1. URL Param Parser: Filters values via enum allowlists.
2. Profile Mapper: Activates visible cards and widgets.
3. Bypass Rule: Forces suspended source warning to load.
→ Safety rule active: workspace filtering cannot remove source warnings.
Mobile diagram key
1 · Parse
Allowlisted URL parameters enter the workspace mapper.
2 · Compose
Ordinary dashboard modules follow the selected profile.
3 · Override
Source warnings bypass workspace filtering.